Posted by: Josh Lehner | April 18, 2024

Oregon’s Strong Labor Market, March 2024

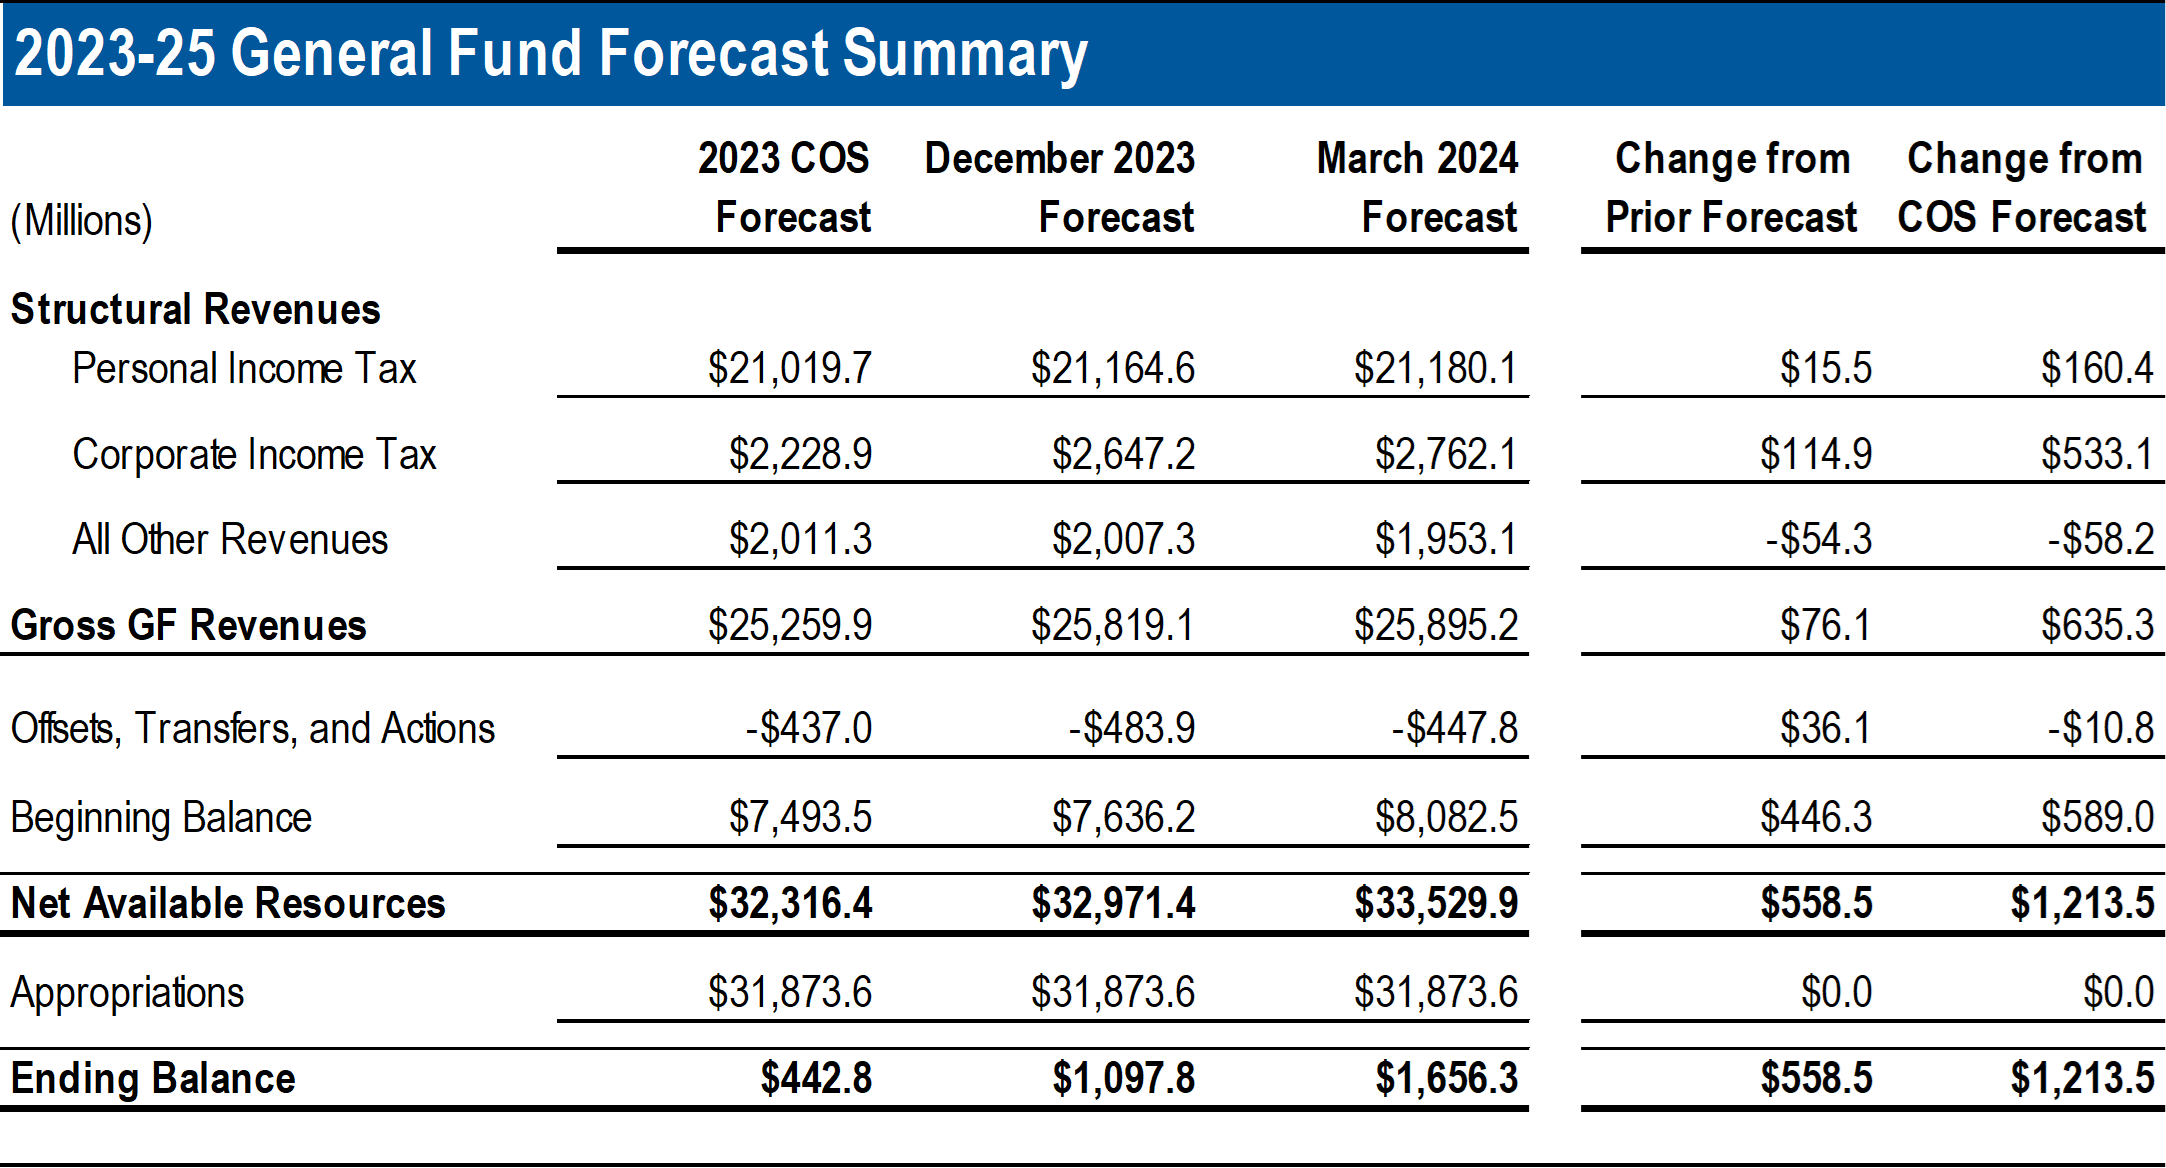
Yesterday our friends at the Employment Department released the March 2024 employment data for Oregon. Our office is developing the next forecast – due out at the end of May – and we will have a lot more to say about the recent job numbers, the downward revisions to last year’s payroll jobs data, and the outlook in the coming weeks. But I wanted to highlight one thing that stood out to me in the latest data, and some of the implications when we think through how we define a strong economy.

First, the data I am using here comes from the household survey. It is a relatively small sample in Oregon, and can be noisy. Undoubtedly, some of the recent upticks could simply be favorable noise in the data that overstates things. Future data revisions may be less kind. We don’t know. But, even if this is the case, the underlying trends, and points I am trying to make remain.

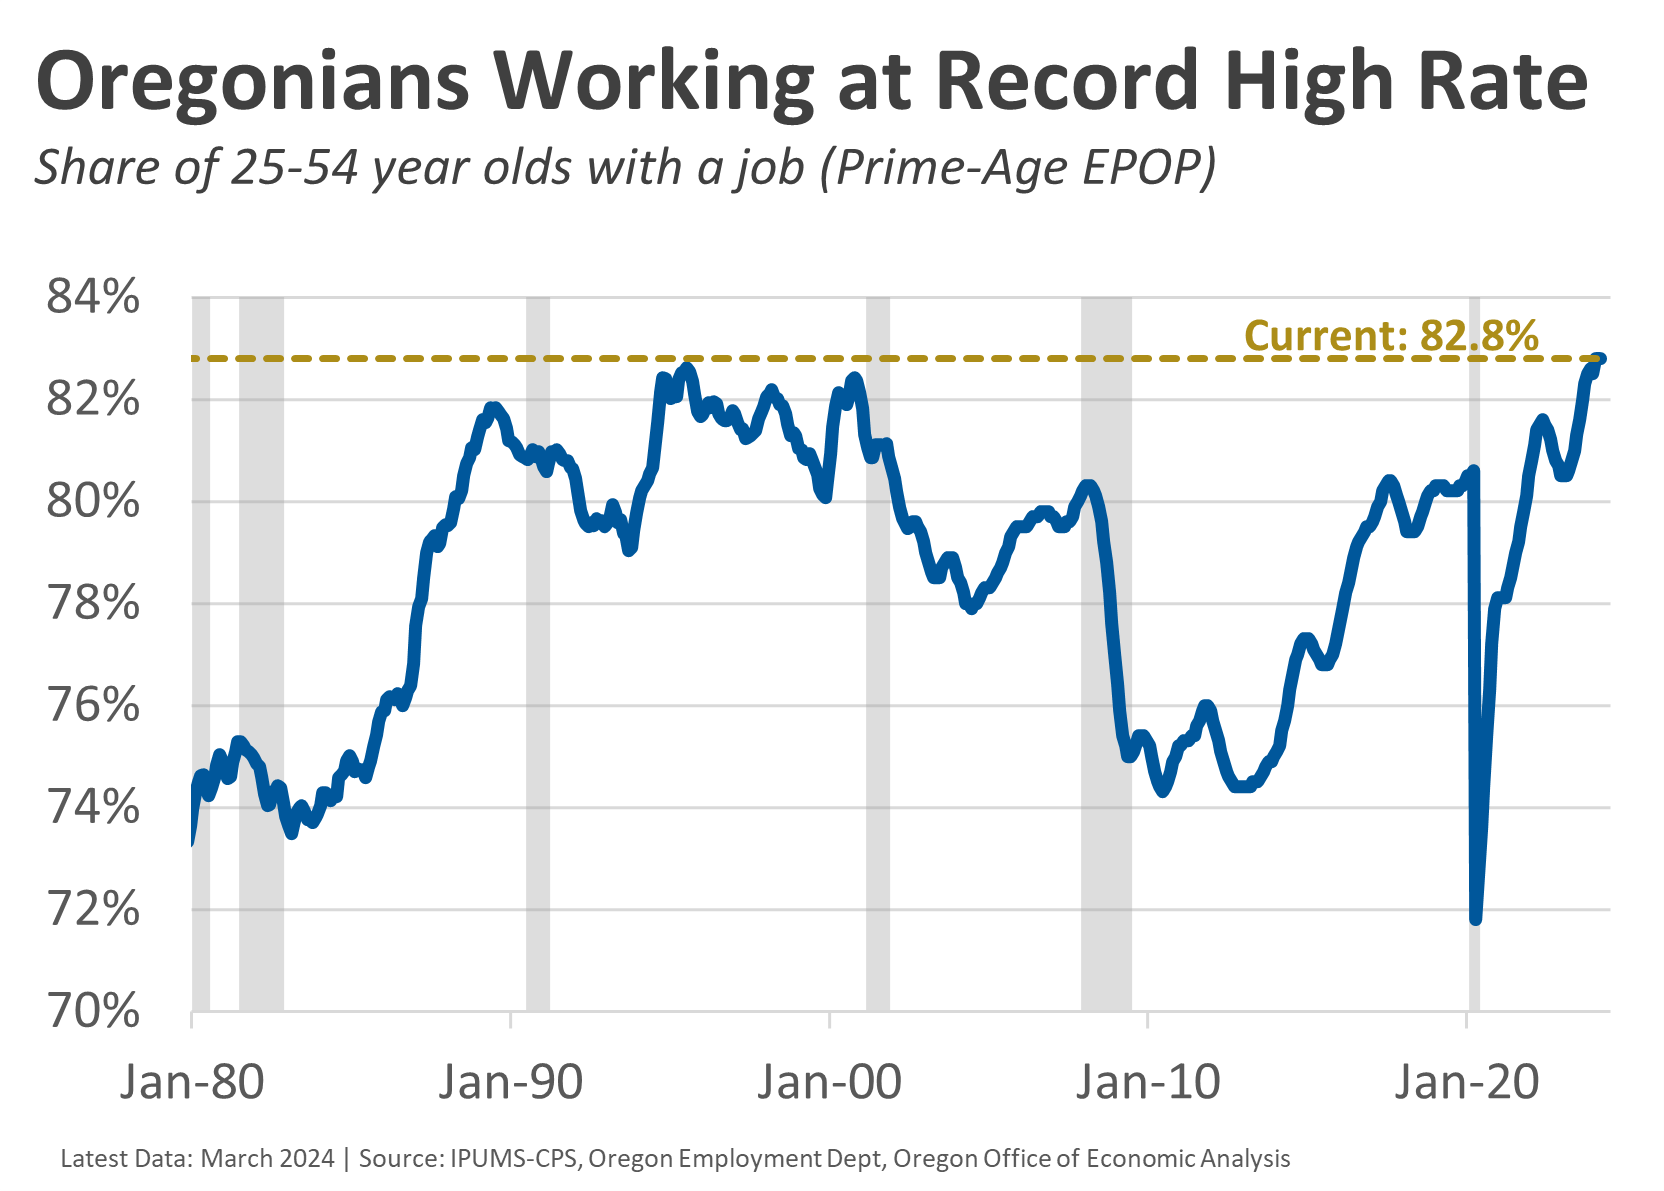
Currently the share of prime-age Oregonians who have a job is at a record high. The state has been at the top of the historical range in recent years, and the latest data shows further improvements that now surpass the rates experienced in the 1990s. Remember, economists focus on prime-age employment not because younger and older workers don’t matter, they do. The focus here is because this age cohort is out of their traditional schooling years, and not yet into their early retirement years (for those who do so). The prime-age population is essentially those who work, those who stay home to take care of the kids, or they are unemployed because the economy is bad. That means trends in the employment rate (the employment to population ratio, or EPOP) are highly correlated with the state of the economy. Nationally, the prime-age EPOP is near an all-time high, while here in Oregon, based on the current data, it is.

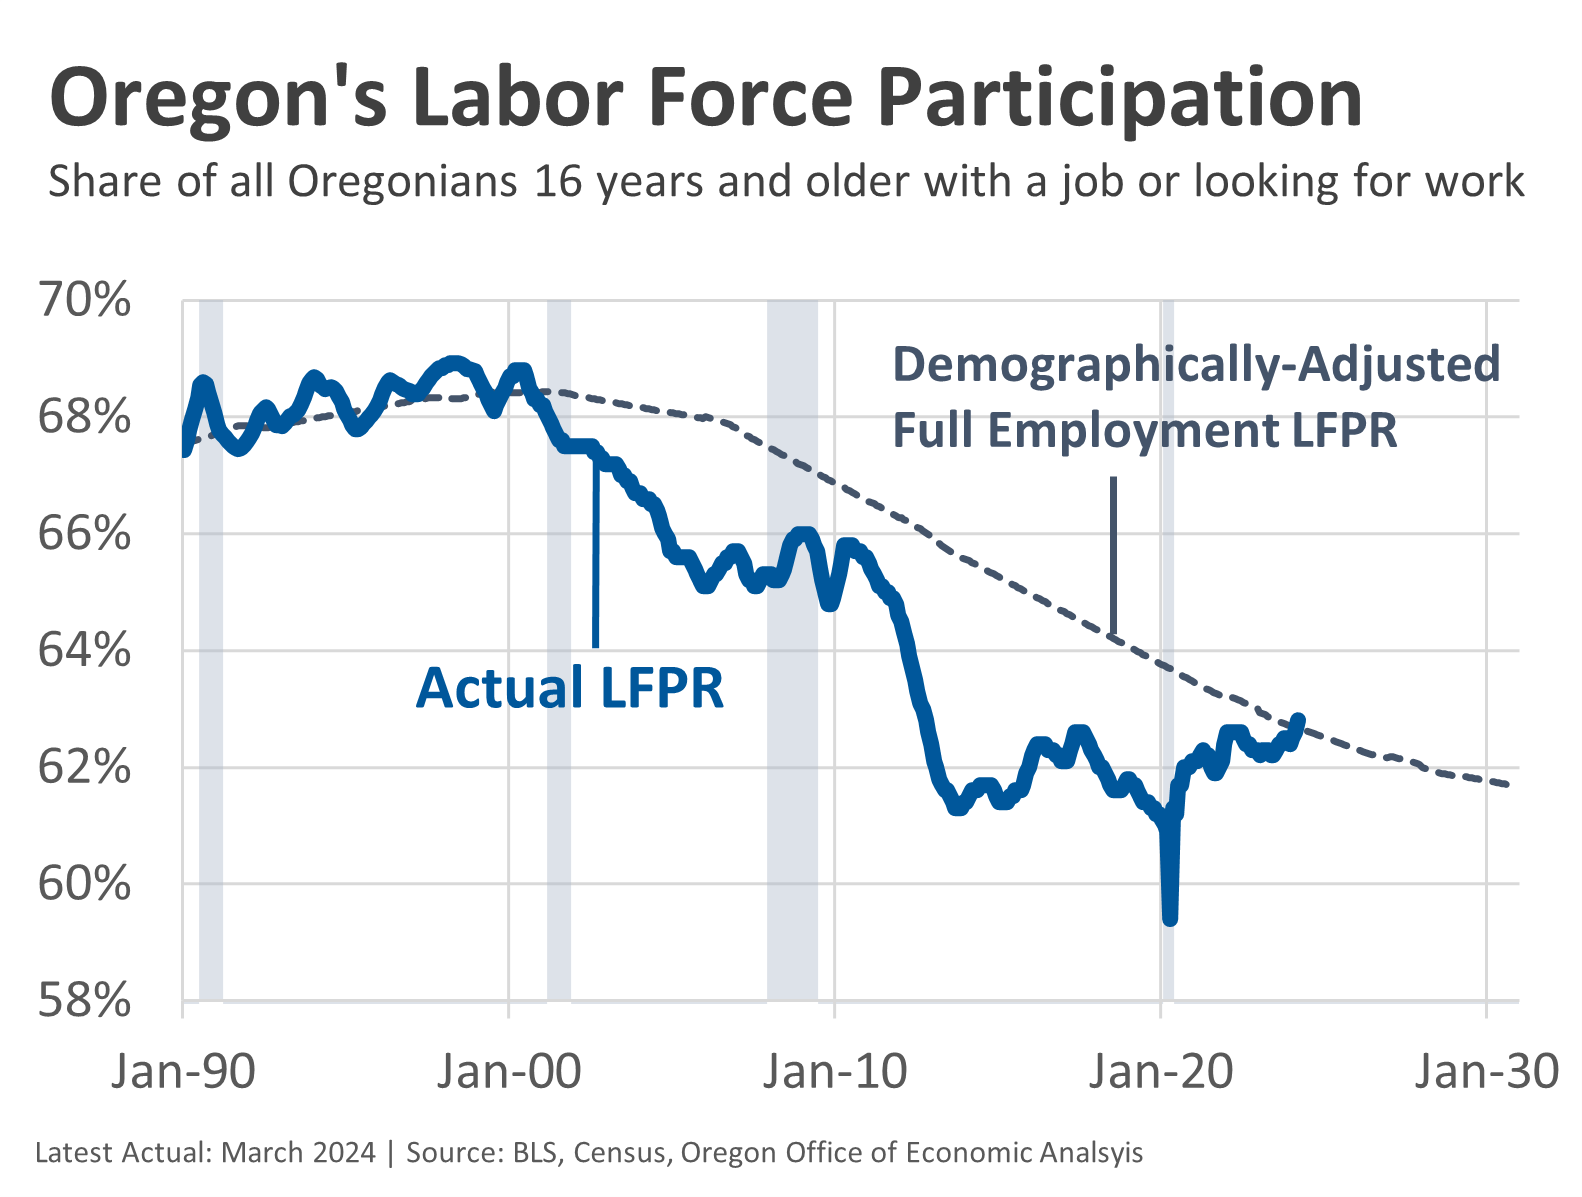
Next, let’s turn to overall labor force participation. At times you will hear comments about declining participation, always spun in a negative way. And, yes, generally speaking fewer people working or looking for work is bad for the economy. However, when it comes to the overall labor force participation rate, it is based on all individuals 16 years and older. That means as our overall population ages, and as the large Baby Boomer generation retires, the overall labor force participation rate will decline simply due to demographics. So you have to control for these underlying demographic changes. There are a few different ways, or time periods to make such calculations. But as seen in the next chart, Oregon’s current labor force participation rate of 62.8% — down nearly 6 percentage points from the 1990s — is perfectly in line with what you would expect to see controlling for demographics in the state. That’s great news for the current state of the economy. And, you can also see how for much of the past two decades the economy was not operating at full employment, either locally or nationally.

The data shown here all point to Oregon being at full employment, and good labor market and economic outcomes for Oregonians today. That’s what we, as a society, should care about! How are you, me, and our neighbors doing?

In the context of a stagnant population with mediocre demographics, these trends are even more important economically. For businesses looking to hire today, either to expand or to replace recent retirees, they are going to have to hire to an even greater degree from the current population. Oregon’s Latent Labor Force is getting smaller as these employment rates increase, and historical disparities decline, but it is still sizable. There remains a lot of untapped economic potential already living here.

The potential shift in the broad economic discussion, depending upon what happens with migration trends in the years ahead, is focusing less on raw growth, and more on these economic outcomes for Oregonians. We should care more about the latter, but still care about the former in terms of measuring economic health and the outlook. Are we getting ahead, or falling behind the nation both on a per person or per household basis, and in terms of broader growth and opportunities?

For a long time we – our office but also in a collective sense – would have discussions about how well Oregon was doing compared to other states based on our topline growth, even as things like our local incomes trailed the nation, our unemployment rate was higher, etc. In recent years it has been the opposite, where our topline growth is not a national leader (and recent payroll jobs data says we lag nearly every other state, a topic we will circle back to for our forecast), but these employment rates, and household incomes for Oregonians are better than the nation.

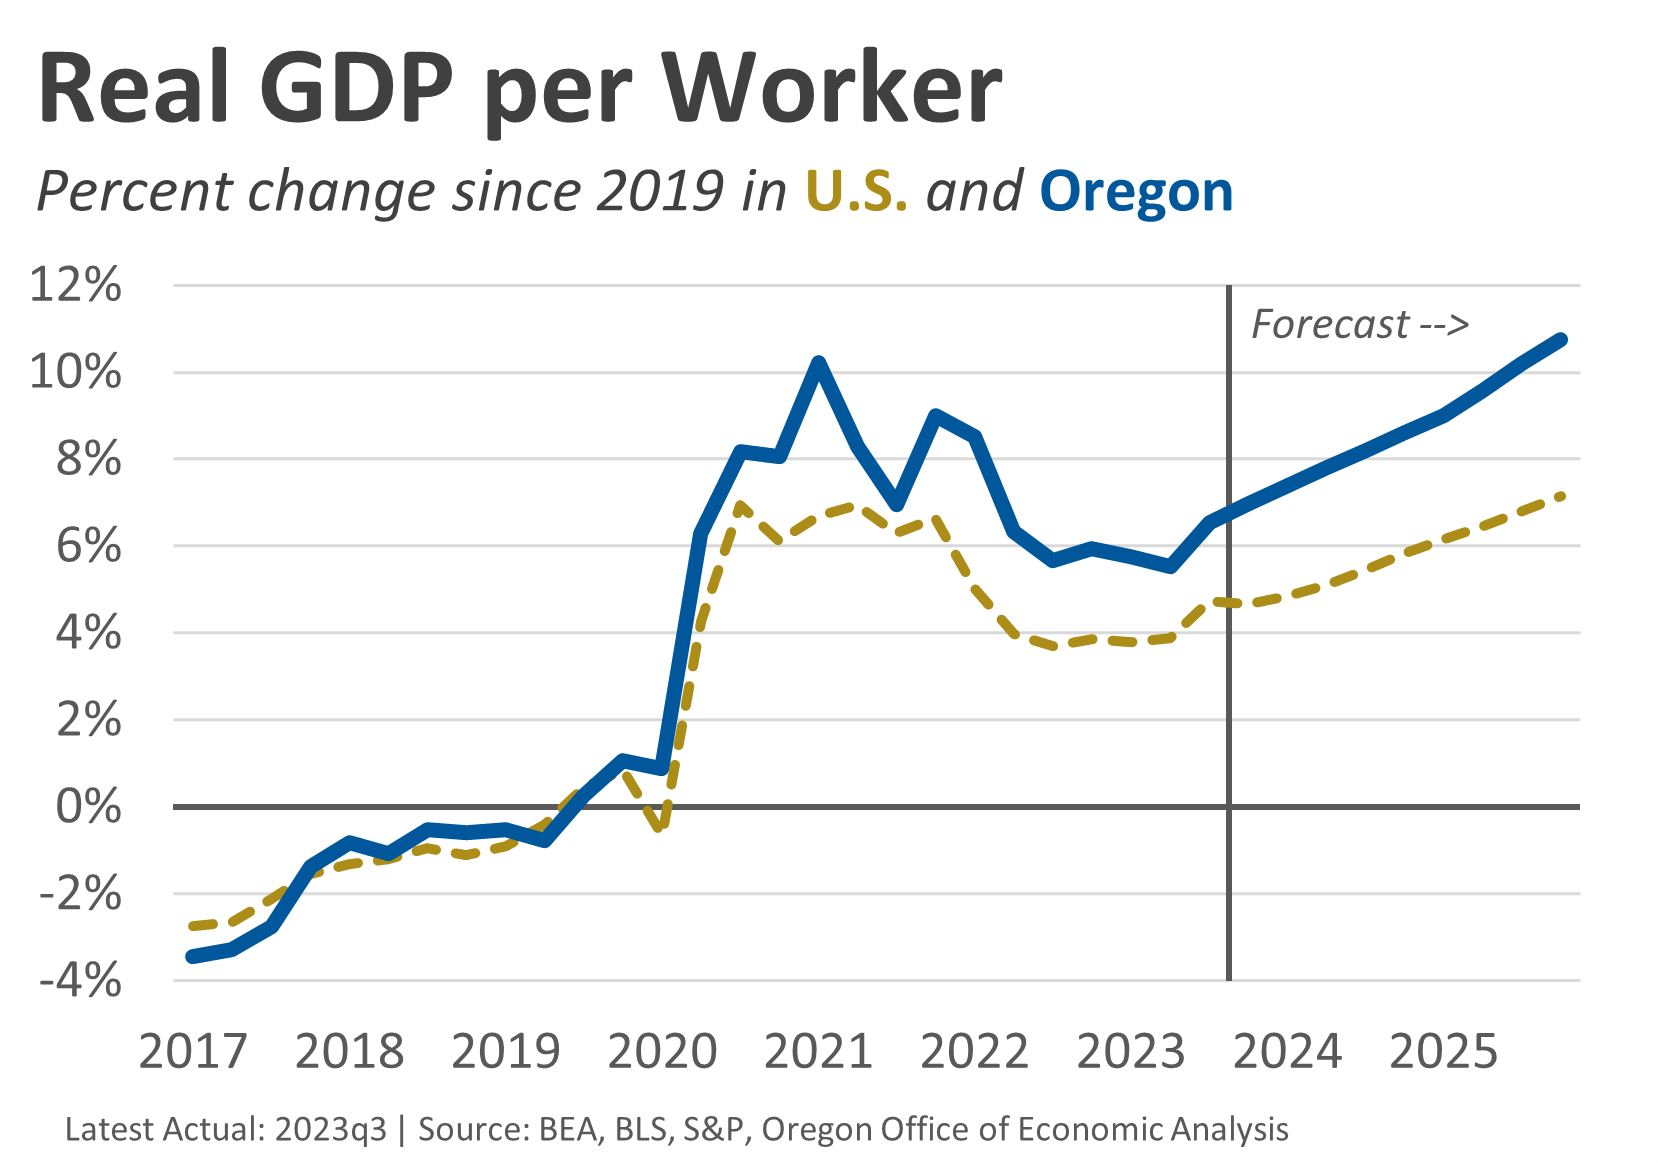
We know this cycle has been different. Oregon’s overall economic growth has been driven to a greater degree by capital investment and productivity than raw population and labor gains compared to the past. Similarly, recent economic progress is seen in stronger incomes and higher employment rates than the nation, rather than local population and employment growth outpacing most other states. This isn’t or shouldn’t be an either/or situation. We should care about having a strong local economy where Oregonians can succeed, and being a place people want to live, and being able to accommodate them by having an adequate supply of housing and the like. It’s important to follow all of these moving parts, and where growth and progress is, and will come from in the years ahead.

Posted by: Josh Lehner | April 11, 2024

Moving Across the River

Southwest Washington is unique. Not only is it an integral part of the Portland regional economy, but also for the State of Washington as well. Like many suburbs, the area has been growing faster for decades, and has outpaced regional and statewide trends. In 1970, Clark County was about 12% of the Portland metro population and nearly 4% of Washington’s. In 2022, Clark County was 21% of the Portland metro population and nearly 7% of Washington’s. While this has certainly been a long-run trend, there are a few periods worth pointing out differences. From about 2005 to 2015, Clark County was a steady share of the Portland region in large part due to the housing bust and initial recovery from the financial crisis was driven by the urban cores in large cities nationwide. And then in recent years, Clark’s relative growth has widened compared to the region, and the State of Washington where it has been the state’s fastest growing county from 2020-2023.

You hear a lot of stories about why. Any single explanation is incomplete, and I cannot do them justice here. We know that the Portland regional economy has done very well over recent decades, and Southwest Washington is an important part of that. Suburbs tend to grow faster, especially those willing to build housing. You can typically get more bang for your housing buck in the suburbs, although it usually comes with a longer commute. That becomes less of an issue as Southwest Washington’s job base grows, and WFH means some workers do not have to drive across the bridge every day. The new Vancouver waterfront has been decades in the making and is a significant regional development.

Then there is the unique border tax effect. We see this in things like vice revenues, and broader consumer and taxpayer behavior. Now, the differences in the two state’s tax structure has narrowed some in recent years. Oregon has the Corporate Activity Tax, and Washington has a capital gains tax. It will be interesting to see how these impact the border effect in the years ahead. Even so, the border tax effect still exists and is very real. Keep in mind that the biggest part of the tax advantage of living in Southwest Washington is tax avoidance, if not outright tax evasion based on the unique location. Earning and realizing income while living and working in Washington minimizes income taxes, while shopping in Oregon minimizes sales taxes. That said, Washingtonians are supposed to pay the use tax on purchases after bringing them back across the river. Such a stark difference in tax policy is pretty rare across the nation, especially within a large population area. While taxes, or public policies more broadly, are rarely the only motivating factor for businesses and households, they clearly play a role in our lives and our behavior.

With all of that said, I wanted to share a couple of graphs related to migration within the Portland metro. Note that we are currently in no man’s land when it comes to Census data. We have topline county population estimates for 2023, but none of the details. We get the topline 2023 ACS published tables in September. That means we are still working with the 2022 ACS microdata, which was just released a few months back. When it comes to this data, we are able to look at people within the four major counties in the metro: Clackamas, Multnomah and Washington counties in Oregon, and Clark County in Washington.

This first chart simply looks at the number of people living in the Portland region, and moving across the river in either direction. You can see that in most years, we see net northern migration. This is true at the statewide level where Oregon consistently sees negative net migration with Washington, primarily due to these within PDX patterns. That said, the net migration numbers tend to be relatively small, maybe a couple thousand people. That changed in the 2022 ACS data where we see a large increase in those moving from the Oregon side of the Portland metro to the Washington side.

(Note that the 2022 ACS data show here shows much larger migration to Clark County than the 2022 Census county population estimates. In the new 2023 county estimates, Clark’s growth holds steady, while Oregon losses get smaller. How that will show up in the 2023 ACS data late this year, particularly on intraregional migration I do not know.)

Similar to our previous look at the relative housing costs of where former Oregon households moved to, I was curious about just who was moving across the river. To help with sample size concerns, I combined two years of pre-pandemic data, with the two most recent years available. The chart below shows the household income of those moving within the Portland metro, but from the Oregon side to the Washington side. What the data show is that the increases are in most income tiers, but primarily driven by those in the upper middle income brackets of $100,000 to $200,000, and not just among the very high income bracket.

Update 4/18/24: Looking at not just the total number of households, but also the migration rate is important to consider. Thanks to Bill in the comments, and a few of you all have asked as well, here is what the migration patterns look like as a percentage of the nonmoving households. You can see the biggest increases in the migration rates are among households with incomes of $100,000-$200,000. Note that pre-pandemic, the very high income households did show a relatively high migration rate. That rate did increase a bit in recent years, but is not nearly as large as the changes seen in that $100-200k range.

Certainly part of the increase in higher income households moving could be due to the economy and generally rising incomes. But if we compare the median household income of folks moving into Clark County, we do see that the rise in former Portlanders on the Oregon side of the river is not matched by similar income gains among everyone else moving into Clark County. The data do show a difference in these income and migration patterns.

Bottom Line: We don’t fully know the reasons why people move. We know humans are complicated, and one definition of economics is constrained optimization, or trying to do the best possible given all of the various variables impacting us. But economists tend to be believers in watching what people do more than listening to what they say. And the data show that Southwest Washington has boomed both as a share of the Portland region, and the State of Washington. Given it is literally in a different state, Southwest Washington should not really impact a lot of what our office does. However, given it’s importance to the Portland region, and the fact there are a lot of residents working in Oregon and paying income taxes, these trends and impacts are very much worth paying attention to. Our office will update these numbers when the 2023 microdata become available near the end of the year.

Posted by: Josh Lehner | April 3, 2024

Job Polarization, a 2023 Post-Pandemic Update

This morning the Bureau of Labor Statistics released the 2023 occupational and wage data for the nation, states, and metro areas. These data are for May of each year, so we can get a detailed look at the occupational employment patterns as of May 2023. The high-level summary looking through the job polarization lens is as follows. For more on job polarization you can see our office’s initial report here, and there are near-annual chart and data updates here on the blog.

We know the pandemic is different from recent cycles. It was not an economic cycle per se but rather a public health crisis that impacted the economy. Unlike in the dotcom bust or Great Recession, the job losses were not primarily middle-wage jobs. Rather, most pandemic job losses were in front-facing industries, which have a lot of low-paying occupations.

Two things really stand out to me in the new data. The first thing is that these low-wage jobs are not back. The 2023 increases were much smaller than I anticipated. The same is true nationally, but the low-wage jobs rebound nationally is stronger than the Oregon one. In the payroll survey, Oregon’s employment in industries like retail, leisure and hospitality, and other services were not fully back as of May 2023 either, but the gaps were smaller than those seen here in occupations like food prep and sales. The industry numbers were a few percent below pre-pandemic readings, while the occupational numbers are more like 5-10% lower. Now, this could just be a timing/data discrepancy. However, it could also point toward occupational shifts within industries as firms’ staffing patterns changed either due to operational changes, out of necessity given the tight labor market, or simply they have been unable to hire workers at a competitive market wage and are making do with the staff they do have.

The second thing is that middle-wage jobs are now at an all-time high in Oregon. The middle-wage job recovery from the 2001 recession took 7 years, while the recovery from the Great Recession took 12 years. The pandemic essentially took 3 years (technically 4 given how the data is for May of each year so we are comparing May 2019 to May 2023). More on middle-wage jobs in a minute.

Additionally, high-wage jobs have continued to grow the entire cycle, as we know working-from-home helped minimize job losses early in the cycle.

I want to focus on middle-wage jobs for a moment. I know the term became a buzzword last decade. The definition can be a bit squishy and means different things to different people. For our office, it comes from the original job polarization research that focused on routine occupations, or those potentially more susceptible to automation and technological change. These routine occupations also tended to fall in the middle 50% of the wage distribution as well, with roughly 25% of jobs being low-wage and 25% being high-wage. These percentages do shift around a bit over time given economic changes, and the erosion of middle-wage jobs (now 46% of Oregon jobs) is a big concern, particularly for workers without college degrees.

Now, the pandemic has been different. Middle-wage jobs did decline initially but less than in past recessions and have now fully recovered. That’s great news overall. But something that stands out to me within these occupational groups is a really stark difference between different types of jobs. In particular, classic blue-collar occupations like construction, installation/maintenance/repair, production (manufacturing), and transportation and material moving have increase substantially. Looking at the 2022 ACS data, 84% of these occupations in Oregon are filled by men.

On the other hand, classic middle-wage jobs that are primarily filled by women have declined and not recovered. Educators (70% female) is more or less steady, albeit still below pre-pandemic numbers, which is similar to the K-12 education payroll employment (and enrollment) data. Office and administrative support jobs (also 70% female) are down 6% (14,150 jobs) and show no recovery. This could be another place where WFH is having a structural impact on the economy. For more, see our previous work on how the decline of office support jobs for women matched the decline of production jobs for men.

When it comes to construction, our office has written quite a bit in recent years about the industry and the need for more workers to meet the demand when it comes to increasing new housing construction, building infrastructure projects and business expansion plans like the upcoming semiconductor investments. What we see in this new data today is the continued, ongoing occupational shift within the industry. Yes, the number of jobs is up, but the bulk of those job gains are not in the trades but rather in office-based staff.

Specifically, the number of Oregonians working in the construction industry in a construction occupation is essentially flat, although there are gains in the installation/maintenance/repair occupations which are also part of the trades. Even so, the vast majority of the industry employment gains in recent years are in management, business and finance, and architecture and engineering occupations. To the extent this increases the productive capacity of the industry by being able to design and manage more projects, this is great news and hopefully pays dividends in the years ahead. To the extent this trend is construction firms becoming more vertically integrated by bringing more business and design staff inhouse as opposed to contracting with outside firms, that could be good for operational efficiencies. But to the extent this trend is more about lower productivity, or things like increased time required to obtain permits for projects, then it is likely bad news not just for the firms but also the economy given the needs and demands for more construction activity.

Finally, let’s take a look at wages. From 2019 to 2023, Oregon’s median wage increased 21.2% which is essentially identical to the national 20.7% increase. Of course we have also seen high inflation as well, with the West Region CPI (All Items) rising 19.4% over the same time period. That means the median wage has barely outpaced inflation in recent years, but it still is positive on an inflation-adjusted basis.

As you may expect, the strongest wage gains are seen among the lowest-paying occupations, while the higher-wage jobs are seeing smaller gains. This is consistent with a lot of other research in recent years. From 2019 to 2023, the median wage among low-wage jobs has risen 26%, compared with 21% gains in middle-wage jobs, and a 17% increase in high-wage jobs. These dynamics differ some each year, but the broader patterns hold up. Wage growth was strongest across the board in 2023, likely in part as workers received raises following the 8%+ inflation in 2022.

Note: BLS cautions against using these data in a time series manner, in part due to some shifting occupational definitions, and the data is meant to be a snapshot in time. I do use the data in a time series manner anyway, in part because other occupational data from places like the household survey and the ACS are in broad agreement with the trends seen in this particular dataset as well. This dataset also does have more granular details on employment and wages, and less noise due to survey sample size issues that impact the other sources for a smaller state like Oregon.

Posted by: Josh Lehner | March 20, 2024

Same-Sex Households

Recently I was part of the Oregon Realtors’ Fair Housing Summit. Besides general outlook topics, I put together a few demographic-focused pieces that included a housing angle. These include a look at racial and ethnic diversity, one-person households by age, and same-sex households . Race, sexual orientation, and age are all protected classes by law. I have also fleshed these out a bit further in the time since. You can think of these posts as a mini-series on demographics and housing.

When it comes to diversity in Oregon, the state’s LGBTQ+ population, as a share of the statewide population, is a national leader. This goes for data based on public polling, research coming from third party sites or organizations, and official Census Bureau data. The specific figures can be a bit different depending on the data source, but Oregon, along with our neighbor to the north, and much of New England, tend to be at or near the top when looking across all states.

What follows is a look specifically at same-sex households based on data from the American Community Survey. Our office tends to stick with official federal statistical agency data when possible. A few years ago Census added detail to their household composition questions to distinguish between same-sex and opposite-sex partners, both in terms of married couples and unmarried cohabitating couples. This means the ACS data is for couples only, and is not about the overall population per se. The good news here is that the relative patterns nationwide are quite similar to other data sources available.

With that, let’s dive into the data. The table below ranks the Top 15 in the nation based on the share of all local households that identify as same-sex couples. At the U.S. level 1 percent of all households are same-sex couples. Here in Oregon it is 1.4 percent, ranking third highest across all states. At the metro level, with a focus on large metros with a population of one million residents or more, Portland also ranks third highest at 1.65 percent with only San Francisco, and Seattle seeing slightly higher shares. At the neighborhood level (technically the public use microdata area which is geographies of about 100,000 people), the central eastside of Portland ranks seventh highest nationwide with 4.7 percent of all households identifying as same-sex couples.

The map below shows the share of all local households that are same-sex couples across all of the metropolitan and micropolitan areas in the country. Yellow regions are the highest shares, green are above average, blue are below average, and purple are significantly below average. In general, nearly all of Oregon is average or higher. Although lower rates are seen in the Bend (Deschutes County), Grants Pass (Josephine County), and Roseburg (Douglas County).

Note that to better show the variability in the data I did do some top coding for mapping purposes, where the maximum value is 1.7 percent, matching the SF share.

When it comes to homeownership I want to focus the data just on married couples. The reason is unmarried cohabitating couples tend to be younger, and therefore lower income given their stage in life and lower rates of homeownership. Now, among married Oregon couples, 42% of opposite-sex couples live in the Portland Tri-County area while 58% of same-sex couples do. Specifically, Multnomah County is home to 15% of all opposite-sex married couples statewide, and 37% of the state’s same-sex married couples.

Homeownership among same-sex married couples broadly follows the same patterns by age as for opposite-sex married couples. That said, ownership rates are somewhat lower among those younger than 40, and then similar if not a bit higher for middle-age and older adults. Keep in mind that due to sample size, the local data can be noisy even if the broad trends are clear. In looking at the U.S. data (not shown here) the same exact patterns are seen where there are lower homeownership rates among younger same-sex married couples, but similar or higher rates among older married couples.

At first, I thought given the geographic patterns that part of the lower homeownership rates among younger same-sex married couples could be due to higher housing costs in the Portland region. Not that housing affordability (cost as a share of income) isn’t bad across the state because it is, but from a sticker price view, Portland is generally higher cost of living. As such there was a possibility that the ownership rate differences could be a sort of Simpson’s Paradox. But that is not the case. Younger same-sex married couples have relatively lower rates in Multnomah, in the Portland suburbs, in the state’s other metro areas, and in rural Oregon, while middle-age and older couples have somewhat higher rates. At least in the most recent data this pattern across ages is statewide.

Finally, when it comes to diversity and different socio-economic groups or subpopulations, getting accurate data is challenging. Both from a historical exclusion perspective and a sample size perspective. So it is good to see Census add detail to their available data, and to see that the relative patterns across various data sources are broadly in agreement.

Posted by: Josh Lehner | March 14, 2024

2023 County Population, Census Edition

This morning the Census Bureau released 2023 county and metro population estimates for the whole country. One of the benefits of the Census estimates is that they are nationwide, where the same group of researchers, using the same methodology produce these numbers. It provides a good dataset for comparison in that light, even as we, here in Oregon use the local estimates produced by our friends at Portland State University for much of our work and state policies, etc.

In the big picture it can be hard to frame these 2023 estimates. They are mid-year estimates, so they measure change from July 1, 2022, when we were still not entirely out of the pandemic and its immediate aftermath, and July 1, 2023. On one hand, these 2023 estimates are a continuation of the pandemic era patterns. Large urban counties, and high-cost metros nationwide saw their population decline, while suburban counties grew more quickly. See this great post from Jed Kolko for more. On the other hand, as we wrote about previously, the pendulum is swinging back from the height of the pandemic patterns and so some of these patterns are more muted than a year or two ago. Yes, urban counties lost population again, but at a smaller pace than before. Rural areas, in a broad sense, are no longer seeing relatively strong gains, and many are losing population again, and so on.

Our office has written quite a bit in recent years about population, and the shifts in patterns of growth, or decline. We have lowered our population forecast, and also developed the Zero Migration alternative scenario to help scope out the potential impacts should post-pandemic patterns differ substantially from historical patterns. What follows are a few charts, and one map to help frame these new Census estimates.

First, here is the Census’ map of county level changes from 2022 to 2023. Green counties saw population increase, orange counties saw population decrease.

Second, here are the annual changes at the regional level in Oregon in recent years. You can see that the Portland Metro as a whole moved from a negative in 2022 to essentially flat (-0.03%) in 2023. That shift is the combination of population decline on the Oregon side of the river getting smaller, and Southwest Washington’s stronger gains firming, albeit slower than at the height of the pandemic.

Elsewhere in Oregon, metro areas see a similar pattern in that 2023 was a smaller decline than seen in the 2022 estimates. Central Oregon is a bit of an exception in that while growth slowed noticeably after the height of the pandemic, it looks to have accelerated a bit in 2023 compared to 2022.

Rural Oregon population change has continued to downshift in recent years following the gains early in the pandemic.

Third, this table shows the annual changes in the Census estimates for each individual county on the left. You can clearly see the pandemic pendulum swinging back. If we look at the bottom set of numbers in the table, the number of Oregon counties seeing negative population change moved from 22 to 17. In 2023, half of Oregon’s 36 counties saw accelerating growth compared to 2022, meaning the increases got larger, and/or the declines got smaller. The other half of Oregon counties saw decelerating growth where the increases got smaller, and/or the declines got larger.

A few things that stood out to me include the accelerating population declines both on the coast (Clatsop, Coos, Curry) and in the Gorge (Hood River, Wasco), and then the ongoing solid gains in the Mid-Valley (Benton, Linn) and in Malheur which has been bucking the rural trends for years, likely in part due to some spillover effects of the Boise metro.

The numbers on the right side of the table are a direct comparison of the 2023 population estimates from Census and PSU. Negative numbers mean Census’ current population estimate is lower than PSU. More on that below.

Overall it’s great that we have different sets of demographic and population estimates. It provides different looks and insights. The challenge is when different datasets, well, differ. Right now PSU estimates the states’ population has increased a little bit in recent years, while Census estimates it has declined a tiny amount. What we do know is that both sets of estimates agree that Oregon’s population is not growing quickly. Our office refers to an overall stagnant population during the pandemic.

However, these estimates do differ at the local level. This final chart today compares the 2020-2023 percent change in county population estimates between the PSU numbers on the horizontal axis, and the Census numbers on the vertical axis. Counties above the dotted line, Census estimates grew faster than PSU, while counties below the dotted line, PSU estimates grew faster (or declined less) than Census.

Bottom Line: Oregon’s population slowed down noticeably, and maybe even declined some in recent years. This impacts the economic and revenue outlook moving forward. Our office has lowered the forecast both as a result of recent years, and reduced expectation of what future growth may be. That said, we still believe a modest rebound in migration is the most likely outlook in the years ahead. Time will tell what ultimately happens. We only get demographic data twice a year. These topline estimates in the winter (PSU estimates in Nov, Census state in Dec, county in Mar) and the socio-economic characteristics in the fall (published ACS tables in Sep). We will know more in six months about who moved where in 2023.

For now, slower population growth, or declines means business and capital investment that lead to productivity gains are even more important than before, in order to raise incomes and drive economic growth.

Posted by: Josh Lehner | March 12, 2024

One-Person Households Continue to Increase

Recently I was part of the Oregon Realtors’ Fair Housing Summit. Besides general outlook topics, I put together a few demographic-focused pieces that included a housing angle. These include a look at racial and ethnic diversity, same-sex households, and one-person households by age. Race, sexual orientation, and age are all protected classes by law. I have also fleshed these out a bit further in the time since. You can think of these posts as a mini-series on demographics and housing.

One-person households are a rising share of our society, and housing market. We first dug into this a few years ago. At the time there were some interesting tidbits about how businesses were working to adjust their products to match shifting consumer demand. That giant, bulk package of toilet paper is not practical or needed by every household, even if you can get a cheap hot dog for lunch at the same time.

Today, given the pandemic’s impact on community and social engagements, along with our aging demographics, it seems like the conversation has shifted to be more about loneliness. The Surgeon General says there is an epidemic of loneliness and isolation in America. I am not here to discuss those issues but will make two notes. One, our household formation and composition patterns may be having an impact, or rather the trends are similar, but may or may not be causal. Two, there is a difference between being alone and being lonely. Just because someone lives alone does not mean they are lonely, although they very well may be. I have had a few conversations with cities and nonprofits in recent years regarding the potential relationship and impact of these demographic and housing trends with things like mobility, community engagement, etc.

With that, let’s dive into the data. As of the 2022 ACS data, Oregon had 505,00 one-person households, which accounted for 29% of all households in the state. This is very similar to the nation where there were 37.2 million households, which accounted for 29% of all households nationwide. Both the total number, and share of all households have been increasing in recent decades, albeit slowly. Now, the Oregon numbers bounce around more than the national ones, likely due to sample size, but the longer-run trends are quite similar. (Edit: Previously it said 5 million households nationwide, which is the number of one-person homeowners aged 75 years and older. The total number is the 37.2 million.)

Next let’s look at the patterns of one-person households by age and the contribution to the total by sex. You can see that one-person households are less common at younger ages when most of us live with roommates, and then have a family. Males living alone are a bit more common than females at these younger ages. As we age, the share of us living in one-person households increases, driven predominantly by females. In ones 50s and 60s, divorced Oregonians are the majority of one-person households. Some of that is age-related, but also impacted by the increase in divorces nationwide a handful of decades ago. Today, marriage rates are lower, but so too are divorce rates so it will be interesting to see how this impacts household formation when, say, the Millennials reach their 50s and 60s in another 20 years or so. Lastly, as we age into our 70s and older, widows and widowers, but mostly widows are the largest share of one-person households.

Moving forward, one-person households are expected to continue to increase and at a faster rate than the overall population and household formation in general, but by just a little bit. If one-person households are 29% of all households today, they are expected to be 32% of the net household increase in the decade ahead.

There are quite a few moving parts under the surface to get at those numbers. On one hand Millennials are aging into the higher household formation years overall, but it’s primarily into their family-age years where one-person households are less common. It’s not until one’s mid to late 50s that one-person households begin to increase. A decade from now Millennials will be in their mid 30s to early 50s.

On the other hand, both Gen X and Gen Z will be the primary drivers from a numerical perspective. This is because Gen Z will transition from living at home to living on their own, of which most will have roommates, but some will not. And Gen X is now mid 40s through late 50s and will age through the large increase in one-person households in the decade(s) ahead.

On a third hand, the number of one-person Baby Boomer households is projected to be relatively constant in the decade ahead. This is due to the fact that while the share of Baby Boomer households that are one-person is expected to continue to increase, the total number of Baby Boomer households is expected to decline due to aging and mortality. The combination of a rising share of a declining total is a steady number, in this case at least. Similarly, the number of Silent Generation one-person households will decline significantly.

Finally, bringing it back to the housing market and homebuyers, the differences by age and sex are noticeable, and differ some from the conventional wisdom. The story I hear most frequently is that young, single women are an increasing share of homebuyers. And that does appear to be true. But that fact gets misconstrued in the sense that young, single men are also homebuyers, and then projecting these younger buyers onto any discussion of one-person households more broadly. The biggest gaps here between the sexes is among those of us in our middle-aged years or older. Part of that is it is expensive to buy a home, so homeownership rates increase with income, which also generally means with age, and then layer on the earlier discussions of mortality where women have a longer life expectancy than men.

Bottom Line: One-person households are an increasing share of our society, and our housing market. These trends are in part driven by broader changes related to lower rates of marriage and fertility, but more so driven by our underlying demographics of an aging population, with noticeable differences between men and women. In an upcoming piece we will touch on the potential impact here for housing supply, in terms of new listings of home for sale or rent as we age, move into residential care facilities, or pass away.

Posted by: Josh Lehner | March 6, 2024

Racial Diversity in Oregon

Recently I was part of the Oregon Realtors’ Fair Housing Summit. Besides general outlook topics, I put together a few demographic-focused pieces that included a housing angle. These include a look at racial and ethnic diversity, same-sex households, and one-person households by age. Race, sexual orientation, and age are all protected classes by law. I have also fleshed these out a bit further in the time since. You can think of these posts as a mini-series on demographics and housing.

Over the past decade we have seen a more broad-based, and more inclusive economy than we have historically. Today’s racial poverty gap is the lowest on record, and household income growth has generally been faster among Black, Indigenous, and People of Color (BIPOC) in Oregon. These trends are interacting with, and possibly caused by the long-run trend that America, and Oregon are becoming more diverse in general. Younger generations today have much greater racial and ethnic diversity than older generations. Here in Oregon, nearly one-third of Millennials identify as BIPOC, while 4 in 10 Gen Z Oregonians do. Compare this with the 10-15 percent of older adults in the state who identity as BIPOC.

Note that Oregon is less diverse than the nation, ranking about 30th across all states based on the 2020 Census data. Even so, these same relative patterns by age are seen locally like they are nationally.

Increasing diversity, like all types of demographic change, is going to impact society and culture more broadly, but also the economy. The workforce to today and tomorrow is more diverse than the workforce of yesterday.

When it comes to housing, we know that historical disparities exist. Homeownership rates, and housing wealth, is higher for white, non-Hispanic Americans and Oregonians. However, these disparities are beginning to narrow some. As of 2022, Oregon homeowners were 83% white, non-Hispanic, or 17% BIPOC. If you look at new mortgage originations in recent years, about 25% of them are going to BIPOC borrowers. Note that 2023 state mortgage origination data will be out in a couple of weeks from the FHFA here. I will try and update this chart at that time.

You can see this increase in economic, housing, and racial and ethnicity diversity in the chart below for the Portland metro area. When it comes to the overall population, household income, number of homeowners, and home equity (wealth), each measure is up five or six percentage points in recent years.

However, the racial homeownership gap remains large. This chart uses the ACS microdata and calculates the homeownership rate for each individual age, and then uses a LOESS regression to find the underlying trend amongst the noisy data.

Finally, we can compare this gap between local homeownership rates for white, non-Hispanic Portlanders and their BIPOC neighbors. When we do that in recent years you can see that the relative gap remains the same. Please ignore some of the individual data points, especially at the tail end of the curves where the sample size for homeowners by race and ethnicity at very young, and old years is small. Focus instead on the broad trends seen among the middle-age population.

Unfortunately what the chart above shows is there is no improvement in the homeownership gap. It indicates that all of the increase in homeownership and home equity diversity is entirely about the underlying demographics, and not about reducing the within cohort gap, at least locally. Now, that is better than the gap widening. And encouragingly, it means changing demographics are filtering through into the economy and the housing market at basically a 1:1 rate. However, the lack of real, fundamental improvements is another indication that access to homeownership and wealth remains concentrated with large inequities.

Posted by: Josh Lehner | February 29, 2024

Rogue Valley Outlook

This morning I am giving a presentation at the SOREDI State of the Rogue Valley breakfast. Below is a short summary of my remarks, followed by a copy of my slides.

The issues, risks, and trends in Southern Oregon are quite similar to the state overall. The differences that arise are more about relative magnitudes. But at the end of the day, the region has seen good overall economic growth, and great income gains. Local household incomes have outpaced inflation and matched or exceeded the typical metro area nationwide. The Medford metro area (Jackson County) in particular has seen stronger income growth than 90 percent of metro areas across the country.

Local growth is driven more by strong productivity than by labor or population. Like the state, the region has seen slower population gains or even losses in recent years, depending on the dataset used. (Note Census is set to release the 2023 county estimates in March.) From a demographic perspective, the Rogue Valley labor market is even more challenging. The regional population skews older than other metros in the state, and is similar to rural Oregon. That means as the large Baby Boomer generation retires, it is economically difficult to replace them due to younger generations being smaller, and migration not being as strong.

However, employment and the labor force have recovered and the outlook is picking up. The reason is this demographic churn in the labor market is mostly, although not completely, finished. About two-thirds of Baby Boomers living in the Rogue Valley are no longer working, and labor force participation and employment rates among younger age groups has increased. This means the working-age population is set to grow again in the near future, especially if the region sees a modest rebound in migration like is included in the county forecasts from Portland State’s Population Research Center.

The slowdown in the labor market is more than offset by stronger local productivity gains. Real GDP per worker in the Rogue Valley outpaces nearly 70 percent of all counties in the country. Stronger productivity gains are needed, and expected in the years ahead. Investment in the different types of capital, along with the economic diversity of the region is, ultimately, expected to boost regional and household income gains.

Four main reasons for this are as follows. One is the tight labor market makes capital investment more attractive and profitable for firms. Two is the increase in start-up activity. While the increase in the number of businesses in the Rogue Valley is not as large as it has been statewide, it still is a noticeable increase compared to the years leading up to the pandemic. Three is the increase in private and public investment, including infrastructure. Four is the impact of generative AI on reducing time-consuming tasks, supplementing judgement, and upskilling parts of the workforce.

Finally, housing remains a key topic, risk, and opportunity. Like Oregon overall, housing affordability in the region is bad and depending upon the metric is a bit better or worse than the state. Rental affordability on a residual income basis is more severe locally. Homeownership affordability is a bit better compared with other metro areas in the state. That said, the share of local households in Jackson County who can afford the median sold home has fallen from 40% back in December 2021 to 27% in January 2024 as interest rates rose.

Looking forward, based on the latest population forecasts from Portland State, the region will need to continue to build about the same number of units it currently is. That maintains the status quo. Our office will be producing the first set of housing needs analysis figures later this year, which takes into account the projected future need, historical underproduction, the impact of second homes, and housing for our homeless neighbors. Like the state, housing production will need to ramp up moving forward to meet these needs.

A copy of my slides are below:

Posted by: Josh Lehner | February 23, 2024

OEA is Hiring! We need your skills!

Our office is seeking a dynamic and driven individual to join our team as an Economist. In this role, you will play a pivotal part in shaping critical forecasts that guide decision-making processes across various sectors. Key responsibilities include administering forecasts related to corrections, youth corrections, and public defense. Additional responsibilities will include some combination of the various revenue forecasts (Corporate Activity Tax, Lottery, vice revenues, etc), the clean fuels forecast, overseeing the office’s General Fund tracking and reconciliation process, and administering the office’s data warehouse.

Additionally, you will serve as a strategic advisor to state agencies, providing expert advice on forecast methods and planning strategies, particularly for agencies with limited resources. Your role will involve serving as a point of oversight for all forecast projects, ensuring adherence to best practices and driving continuous improvement initiatives. If you are ready to take on this exciting challenge and make a tangible difference in public finance forecasting, we want to hear from you!

This position is hybrid remote. Much of our work we do, or can do remotely, but do have in-person forecast advisory meetings, forecast releases, and discussions with other agencies and policymakers. And you can work in the office full-time if you prefer as well.

You can find the job posting and apply HERE. That post includes the full position description, along with contact information for Human Resources. Of course, please feel free to reach out directly to Mark or myself (you can find our phone numbers and emails on our main page here.)

Two more things to note.

One, our office has two vacancies. This current job posting is focused on the criminal justice forecasts and analyses our office does. The position will also work on some of the other forecasts and projects we do in our office. We are looking to fill it ASAP with the posting held open until March 6th, when we will begin to review the applicants. The second posting (which is currently going through the class/comp process, but will be another Economist 4 position) will be more revenue forecasting, along with some of the other duties and projects from what we do in our office. If you are interested in either or both of the positions, note that applying for the current position does not exclude you from the second one, and your application can and should carry over if you want it to, given the technical details, qualifications, payscale, etc are the same.

Two, here is the information on salary, qualifications and desired attributes for the position.

Salary Range (annual): $86,928 – $128,088

Minimum Qualifications:

  • A Master’s degree in economics or a related field and four years’ experience doing economic research or econometric forecasting; OR,
    A Ph.D. in economics or a related field and one-year experience doing economic research.

Desired Attributes:

  • Background in math/statistics, finance, economics and/or accounting.
  • Database management and administration experience.
  • Quantitative and statistical analysis skills.
  • Proven skill in report writing, creating graphs and presentations, and being able to explain and present technical information to a general audience.
  • Knowledge of tax policy and public finance.

If you have any questions please reach out, we are happy to chat about the position and what our office does!

Posted by: Josh Lehner | February 7, 2024

Oregon Economic and Revenue Forecast, March 2024

This morning our office released the latest quarterly economic and revenue forecast. For the full document, slides and forecast data please see our main website. Below is the forecast’s Executive Summary and a copy of our presentation slides.

Historically, inflationary economic booms have not ended well. The pandemic is increasingly looking like the exception. Inflation has cooled and is near the Federal Reserve’s target. The labor market rebalanced last year. However, strong recent data in terms of consumer spending, job gains, and real GDP growth raise the possibility of inflation rebounding in the quarters ahead. The Fed is indicating they will cut interest rates this year, but appear to be in no real hurry given the economic strength.

Economic growth is combination of the number of workers and how productive each is. So far this cycle, Oregon’s productivity gains have outpaced the nation, while local job growth is in the middle of the pack across states. The outlook for labor and capital are on differing, structural trends. Labor is both cyclically strong today, and structurally tight due to demographics. The recently released 2023 population estimates show that Oregon’s population continued to stagnate during the pandemic. Our office has lowered the population outlook as a result. In the decade ahead Oregon’s population is expected to rebound, but grow at just 0.6 percent per year. This lower population forecast feeds directly into a relatively smaller labor force and a bit less personal income earned in the years ahead.

The good news is that between the start-up boom, increased federal investment, and potential of generative AI, productivity is set to increase faster in the decade ahead. These gains will boost the overall economy and make up for slower labor growth. Even so, one of the key dynamics for stronger business investment is a tight labor market. When workers are scarce, and expensive, firms are more willing, if not forced to invest in labor-saving technology and processes.

Oregon’s state revenue outlook remains stable heading into the personal income tax filing season. The underlying economic outlook is relatively unchanged, and collections are tracking closely to expectations. Compared to the December 2023 forecast, General Fund revenues are raised $76 million. However, total available resources are increased $558 million in large part due to accountants closing the books on the previous 2021-23 biennium. Unspent appropriations from last biennium revert to the General Fund, boosting resources in 2023-25.

Although overall revenue collections are matching expectations, there have been some notable surprises. The most significant of which is the persistence of the six-year boom in Oregon’s traditional corporate income and excise taxes. Tax collections have far outstripped growth in underlying corporate profits. The longer the surge in collections persists, the more likely it becomes that tax reforms enacted at the federal and state levels have permanently increased Oregon’s corporate tax base, and that the step up in collections will remain with us going forward.

The modest reduction in expected population and job gains reflected in the underlying economic outlook filters through to a somewhat weaker long-term forecast for personal income taxes. That said, these changes do not change the general nature of the revenue forecast, with the largest reduction in expected General Fund resources amounting to less than one percent of revenue in the 2029-31 budget period.

See our full website for all the forecast details. Our presentation slides for the forecast release to the Legislature are below.

Older Posts »

Categories