This morning the Census Bureau released 2023 county and metro population estimates for the whole country. One of the benefits of the Census estimates is that they are nationwide, where the same group of researchers, using the same methodology produce these numbers. It provides a good dataset for comparison in that light, even as we, here in Oregon use the local estimates produced by our friends at Portland State University for much of our work and state policies, etc.
In the big picture it can be hard to frame these 2023 estimates. They are mid-year estimates, so they measure change from July 1, 2022, when we were still not entirely out of the pandemic and its immediate aftermath, and July 1, 2023. On one hand, these 2023 estimates are a continuation of the pandemic era patterns. Large urban counties, and high-cost metros nationwide saw their population decline, while suburban counties grew more quickly. See this great post from Jed Kolko for more. On the other hand, as we wrote about previously, the pendulum is swinging back from the height of the pandemic patterns and so some of these patterns are more muted than a year or two ago. Yes, urban counties lost population again, but at a smaller pace than before. Rural areas, in a broad sense, are no longer seeing relatively strong gains, and many are losing population again, and so on.
Our office has written quite a bit in recent years about population, and the shifts in patterns of growth, or decline. We have lowered our population forecast, and also developed the Zero Migration alternative scenario to help scope out the potential impacts should post-pandemic patterns differ substantially from historical patterns. What follows are a few charts, and one map to help frame these new Census estimates.
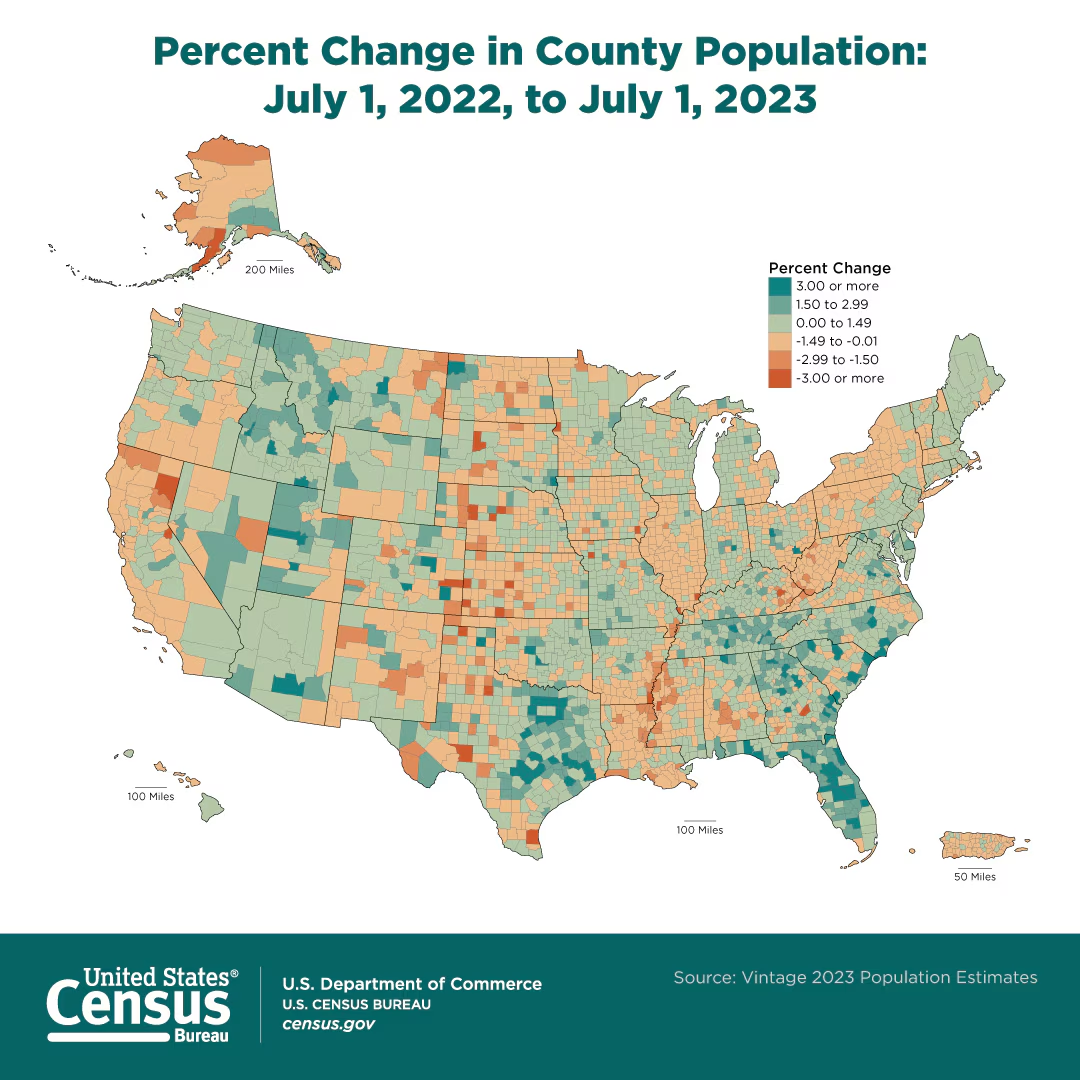
First, here is the Census’ map of county level changes from 2022 to 2023. Green counties saw population increase, orange counties saw population decrease.
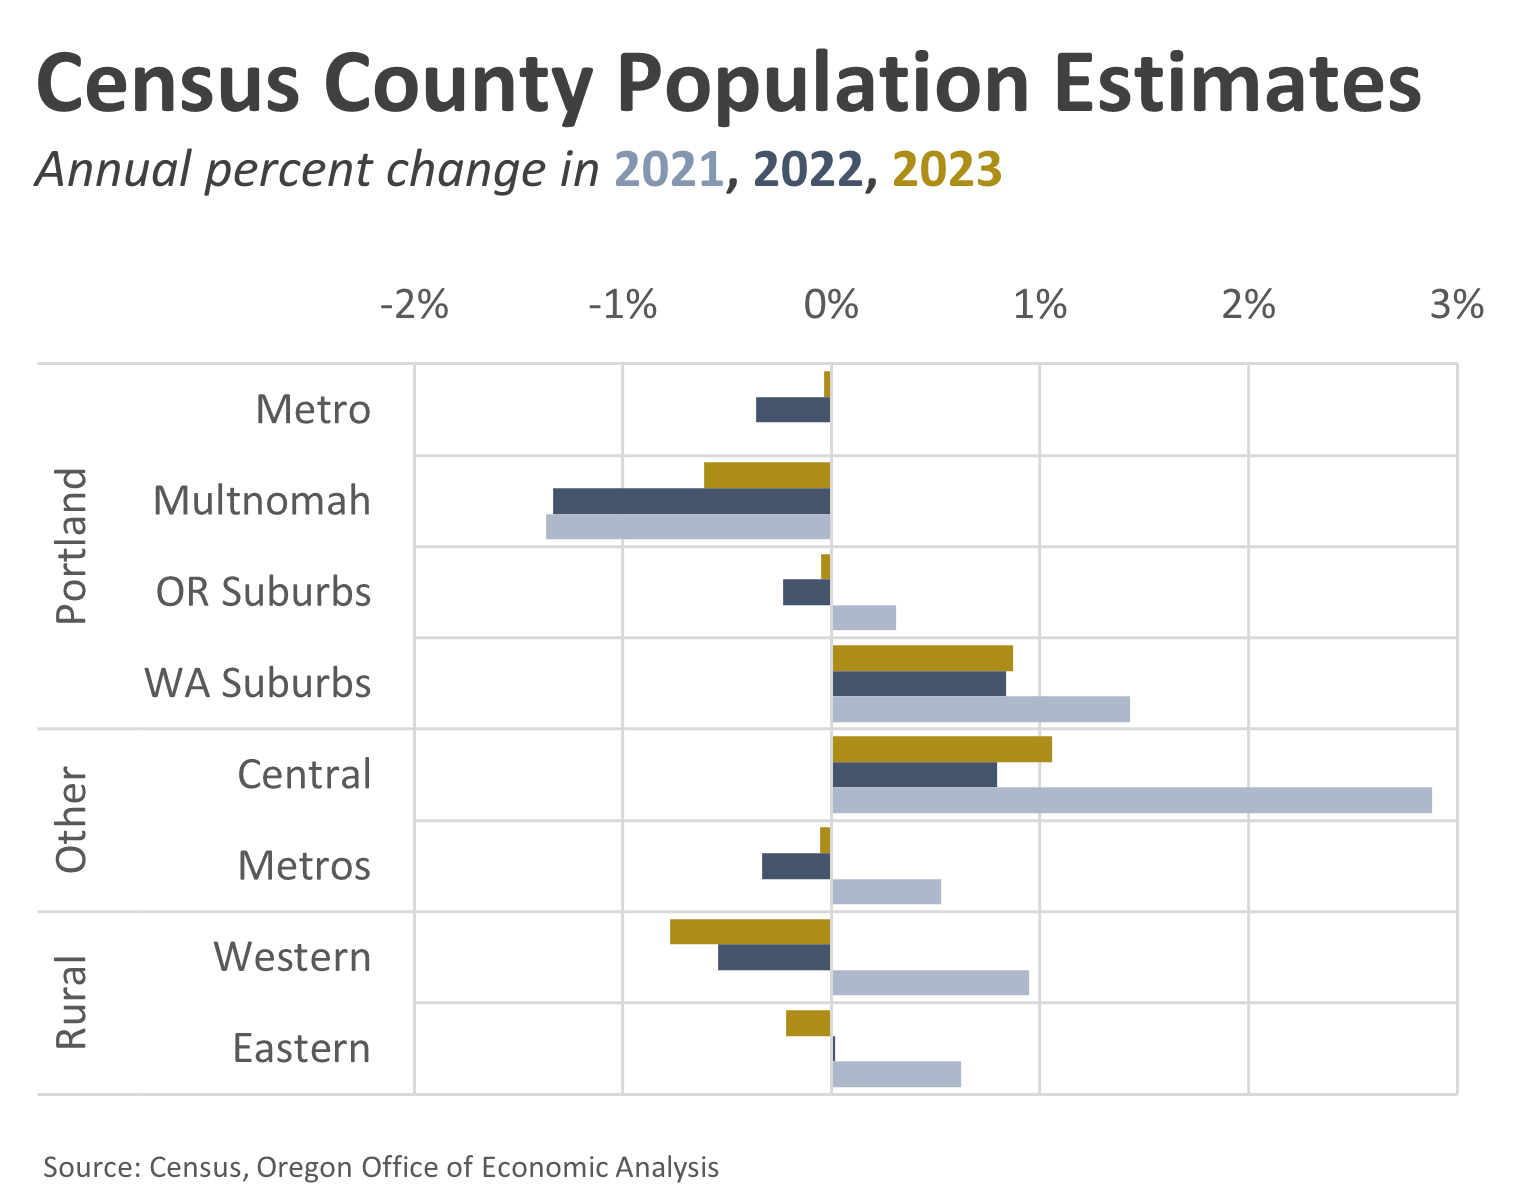
Second, here are the annual changes at the regional level in Oregon in recent years. You can see that the Portland Metro as a whole moved from a negative in 2022 to essentially flat (-0.03%) in 2023. That shift is the combination of population decline on the Oregon side of the river getting smaller, and Southwest Washington’s stronger gains firming, albeit slower than at the height of the pandemic.
Elsewhere in Oregon, metro areas see a similar pattern in that 2023 was a smaller decline than seen in the 2022 estimates. Central Oregon is a bit of an exception in that while growth slowed noticeably after the height of the pandemic, it looks to have accelerated a bit in 2023 compared to 2022.
Rural Oregon population change has continued to downshift in recent years following the gains early in the pandemic.
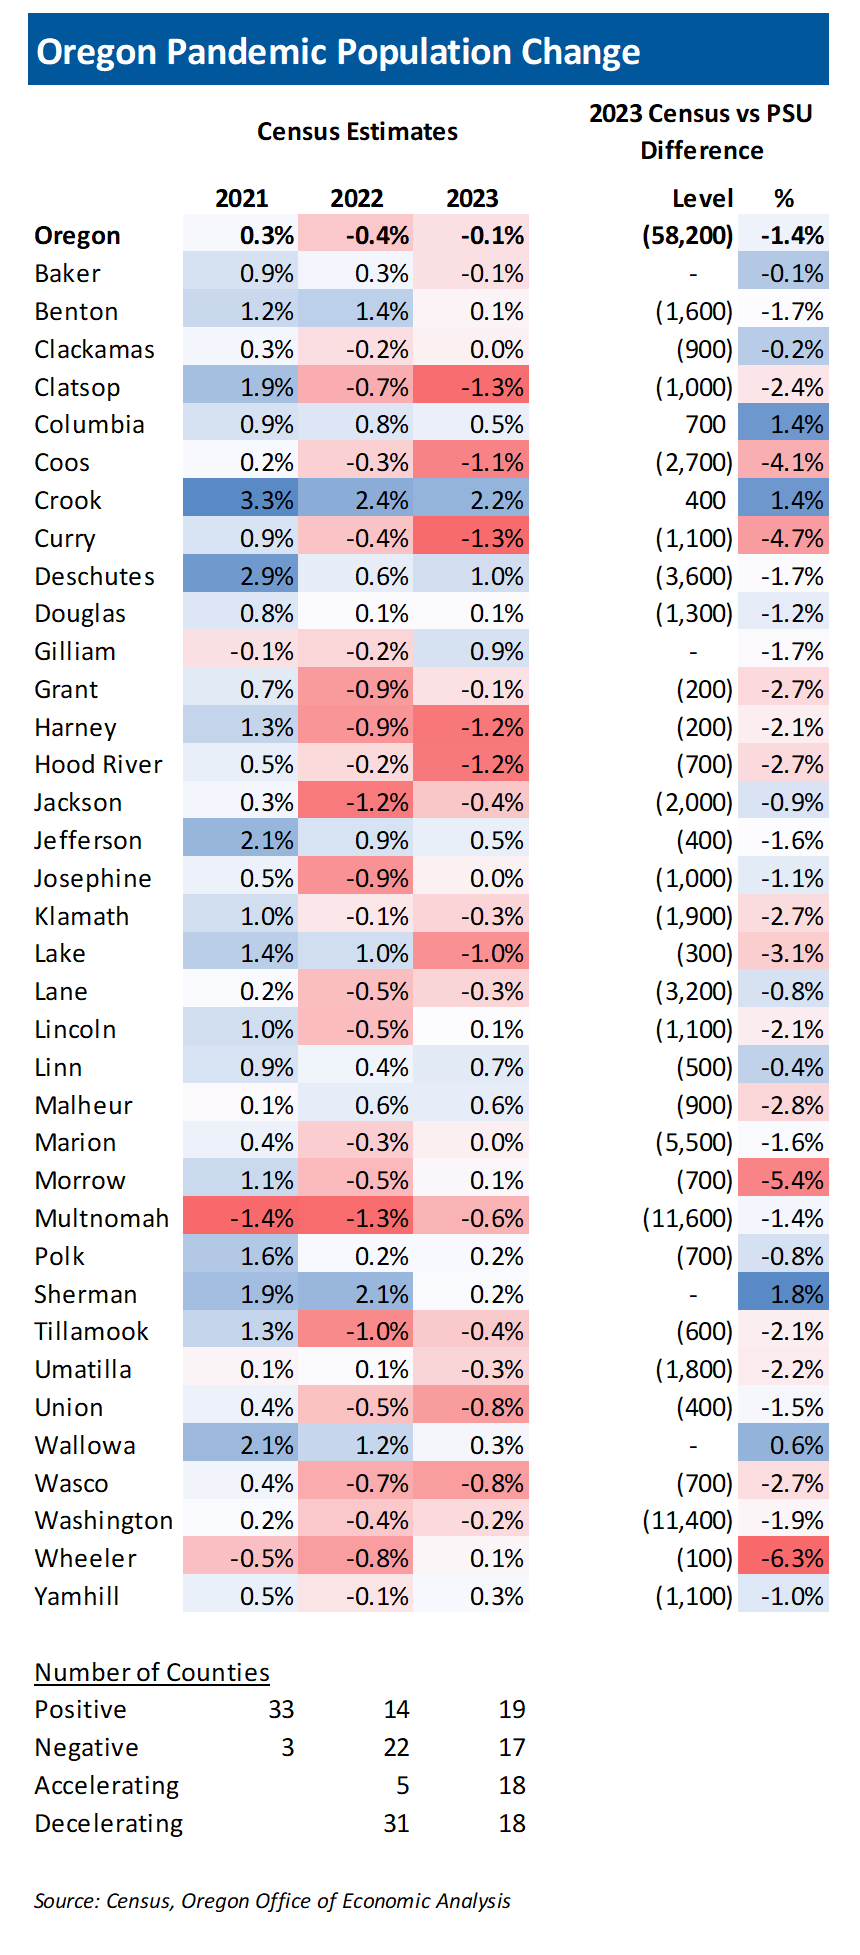
Third, this table shows the annual changes in the Census estimates for each individual county on the left. You can clearly see the pandemic pendulum swinging back. If we look at the bottom set of numbers in the table, the number of Oregon counties seeing negative population change moved from 22 to 17. In 2023, half of Oregon’s 36 counties saw accelerating growth compared to 2022, meaning the increases got larger, and/or the declines got smaller. The other half of Oregon counties saw decelerating growth where the increases got smaller, and/or the declines got larger.
A few things that stood out to me include the accelerating population declines both on the coast (Clatsop, Coos, Curry) and in the Gorge (Hood River, Wasco), and then the ongoing solid gains in the Mid-Valley (Benton, Linn) and in Malheur which has been bucking the rural trends for years, likely in part due to some spillover effects of the Boise metro.
The numbers on the right side of the table are a direct comparison of the 2023 population estimates from Census and PSU. Negative numbers mean Census’ current population estimate is lower than PSU. More on that below.
Overall it’s great that we have different sets of demographic and population estimates. It provides different looks and insights. The challenge is when different datasets, well, differ. Right now PSU estimates the states’ population has increased a little bit in recent years, while Census estimates it has declined a tiny amount. What we do know is that both sets of estimates agree that Oregon’s population is not growing quickly. Our office refers to an overall stagnant population during the pandemic.
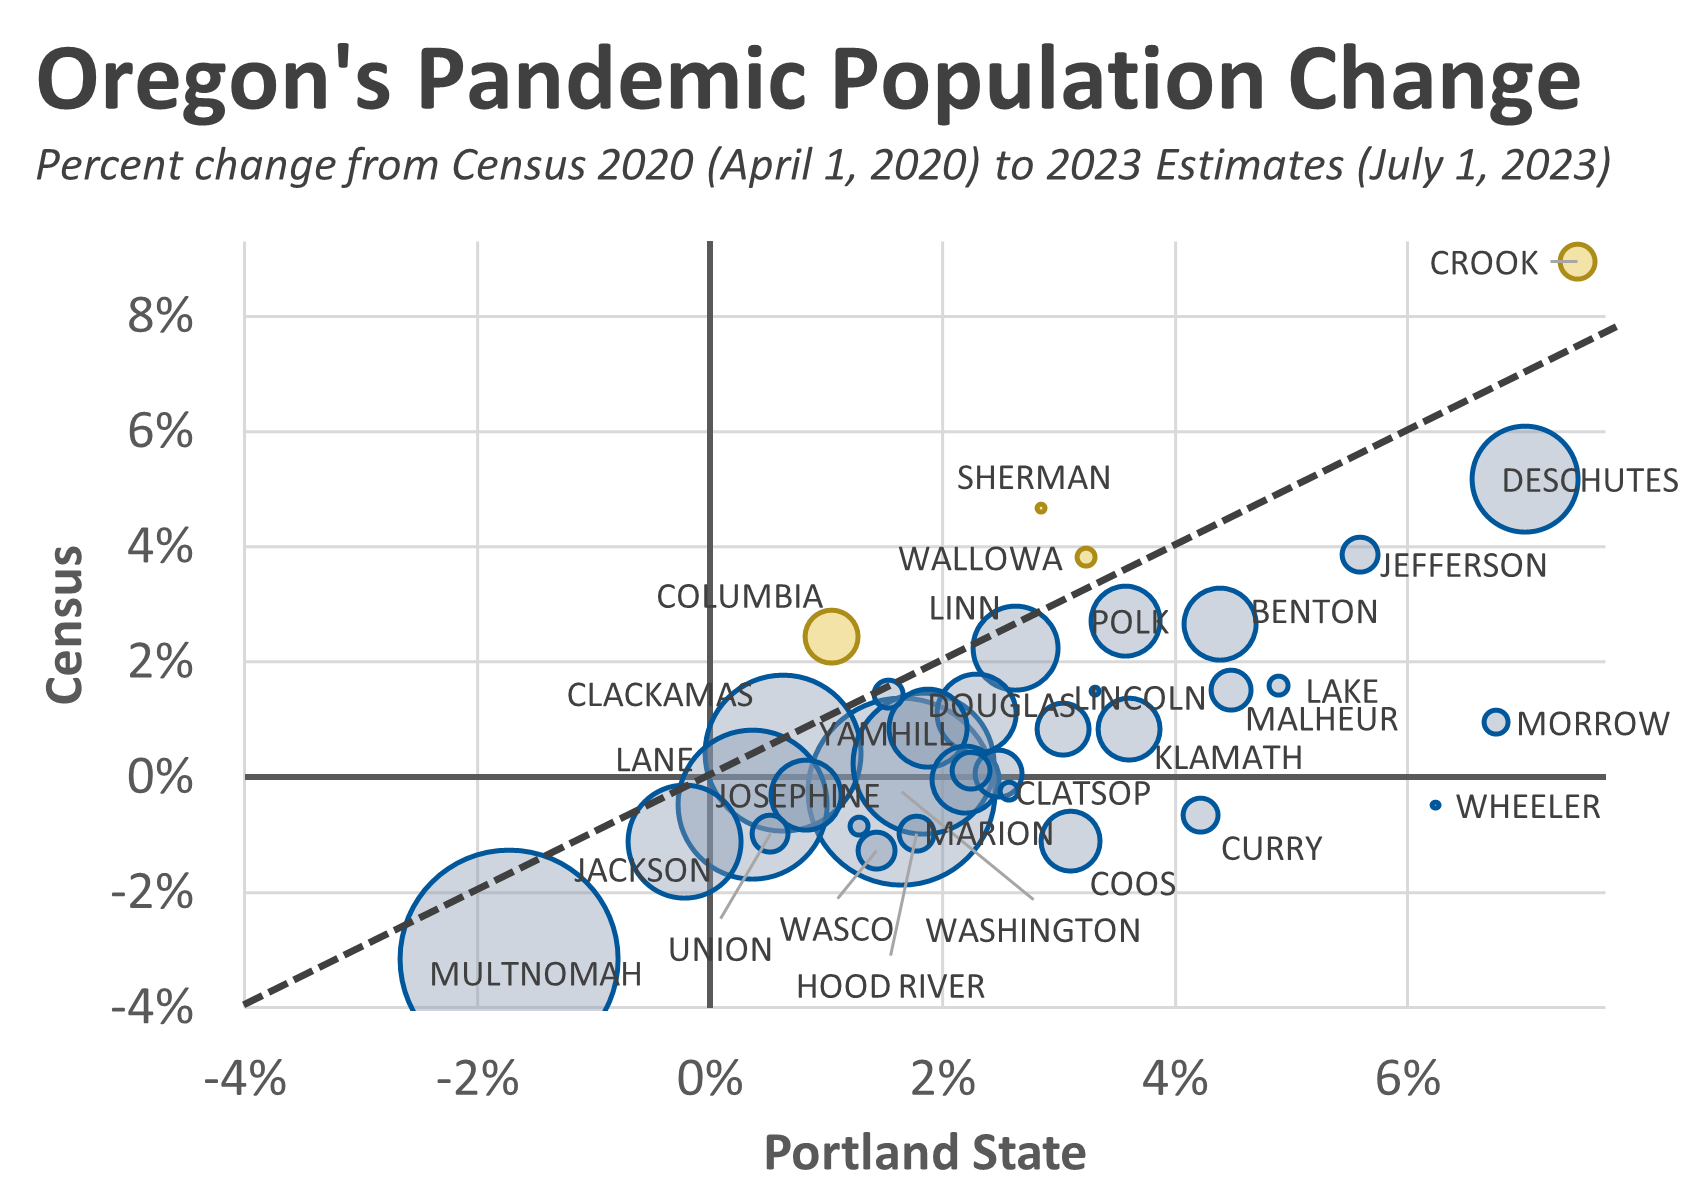
However, these estimates do differ at the local level. This final chart today compares the 2020-2023 percent change in county population estimates between the PSU numbers on the horizontal axis, and the Census numbers on the vertical axis. Counties above the dotted line, Census estimates grew faster than PSU, while counties below the dotted line, PSU estimates grew faster (or declined less) than Census.
Bottom Line: Oregon’s population slowed down noticeably, and maybe even declined some in recent years. This impacts the economic and revenue outlook moving forward. Our office has lowered the forecast both as a result of recent years, and reduced expectation of what future growth may be. That said, we still believe a modest rebound in migration is the most likely outlook in the years ahead. Time will tell what ultimately happens. We only get demographic data twice a year. These topline estimates in the winter (PSU estimates in Nov, Census state in Dec, county in Mar) and the socio-economic characteristics in the fall (published ACS tables in Sep). We will know more in six months about who moved where in 2023.
For now, slower population growth, or declines means business and capital investment that lead to productivity gains are even more important than before, in order to raise incomes and drive economic growth.

Hello Office of Economic Analysis, this is such an interesting post. Thanks for pulling it together. I would love to see a similar analysis combined with household income. I’d guess that the households heading over to the WA side of the Portland metro area skew high income. Remote work has lowered a barrier to take advantage of the 2 states’ wildly different tax structures. I think it would be useful information for us all to understand.
Thanks for your excellent work!
Anne
By: FIFIELD Anne E on March 14, 2024
at 5:18 PM