Yesterday our friends at the Employment Department released the March 2024 employment data for Oregon. Our office is developing the next forecast – due out at the end of May – and we will have a lot more to say about the recent job numbers, the downward revisions to last year’s payroll jobs data, and the outlook in the coming weeks. But I wanted to highlight one thing that stood out to me in the latest data, and some of the implications when we think through how we define a strong economy.
First, the data I am using here comes from the household survey. It is a relatively small sample in Oregon, and can be noisy. Undoubtedly, some of the recent upticks could simply be favorable noise in the data that overstates things. Future data revisions may be less kind. We don’t know. But, even if this is the case, the underlying trends, and points I am trying to make remain.
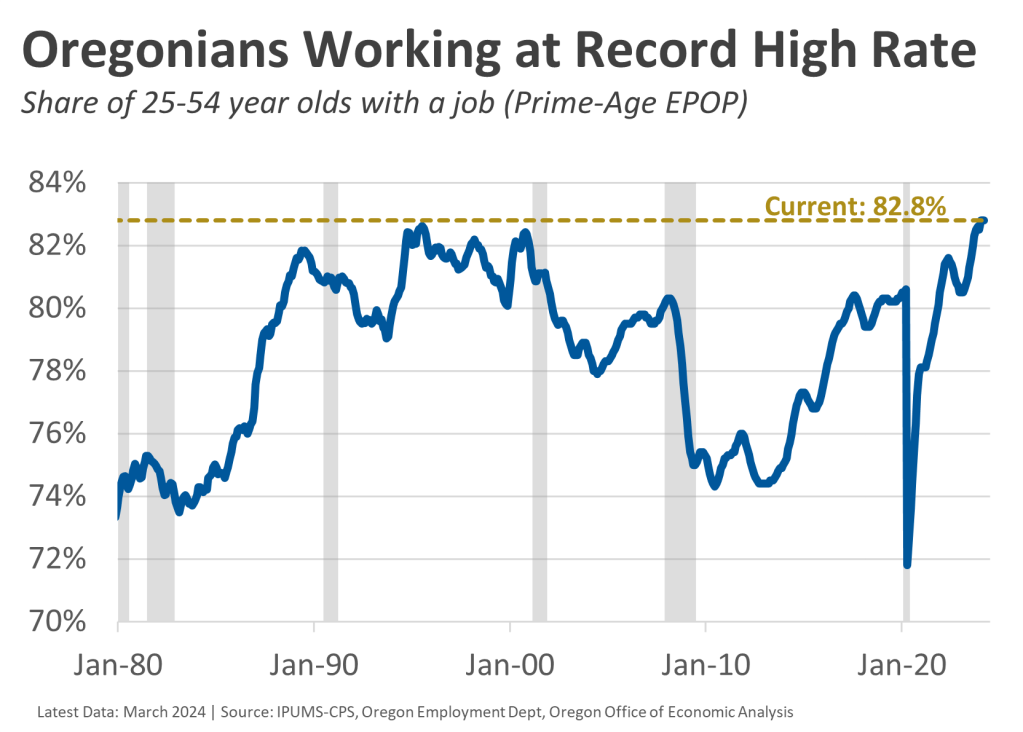
Currently the share of prime-age Oregonians who have a job is at a record high. The state has been at the top of the historical range in recent years, and the latest data shows further improvements that now surpass the rates experienced in the 1990s. Remember, economists focus on prime-age employment not because younger and older workers don’t matter, they do. The focus here is because this age cohort is out of their traditional schooling years, and not yet into their early retirement years (for those who do so). The prime-age population is essentially those who work, those who stay home to take care of the kids, or they are unemployed because the economy is bad. That means trends in the employment rate (the employment to population ratio, or EPOP) are highly correlated with the state of the economy. Nationally, the prime-age EPOP is near an all-time high, while here in Oregon, based on the current data, it is.

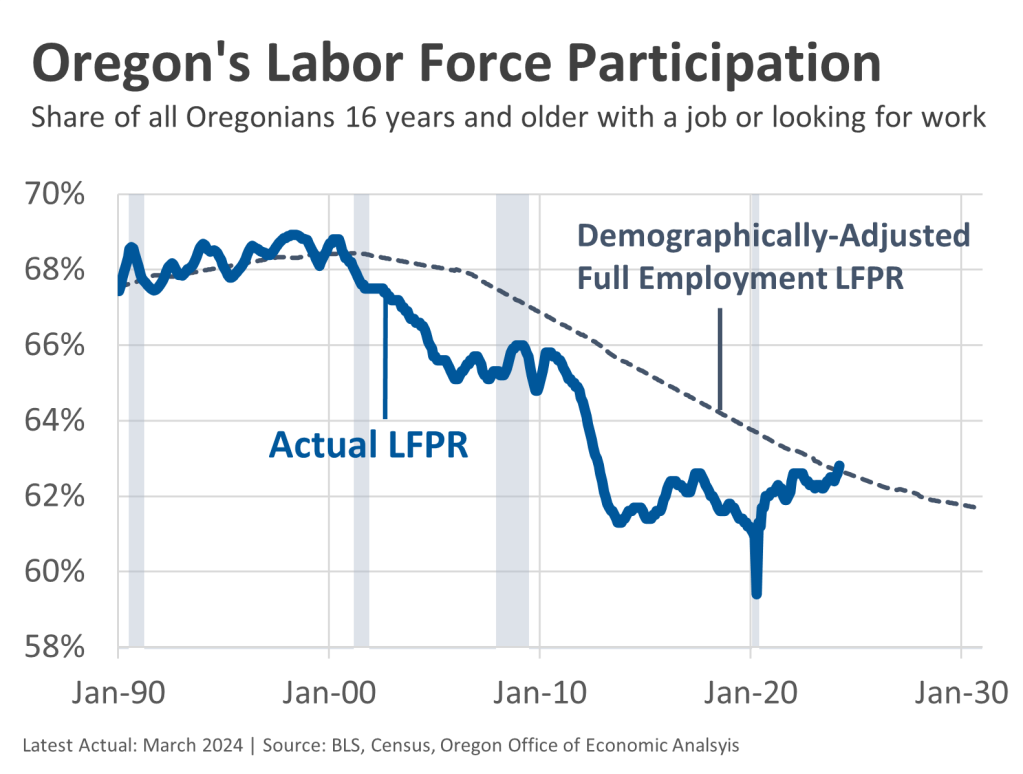
Next, let’s turn to overall labor force participation. At times you will hear comments about declining participation, always spun in a negative way. And, yes, generally speaking fewer people working or looking for work is bad for the economy. However, when it comes to the overall labor force participation rate, it is based on all individuals 16 years and older. That means as our overall population ages, and as the large Baby Boomer generation retires, the overall labor force participation rate will decline simply due to demographics. So you have to control for these underlying demographic changes. There are a few different ways, or time periods to make such calculations. But as seen in the next chart, Oregon’s current labor force participation rate of 62.8% — down nearly 6 percentage points from the 1990s — is perfectly in line with what you would expect to see controlling for demographics in the state. That’s great news for the current state of the economy. And, you can also see how for much of the past two decades the economy was not operating at full employment, either locally or nationally.

The data shown here all point to Oregon being at full employment, and good labor market and economic outcomes for Oregonians today. That’s what we, as a society, should care about! How are you, me, and our neighbors doing?
In the context of a stagnant population with mediocre demographics, these trends are even more important economically. For businesses looking to hire today, either to expand or to replace recent retirees, they are going to have to hire to an even greater degree from the current population. Oregon’s Latent Labor Force is getting smaller as these employment rates increase, and historical disparities decline, but it is still sizable. There remains a lot of untapped economic potential already living here.
The potential shift in the broad economic discussion, depending upon what happens with migration trends in the years ahead, is focusing less on raw growth, and more on these economic outcomes for Oregonians. We should care more about the latter, but still care about the former in terms of measuring economic health and the outlook. Are we getting ahead, or falling behind the nation both on a per person or per household basis, and in terms of broader growth and opportunities?
For a long time we – our office but also in a collective sense – would have discussions about how well Oregon was doing compared to other states based on our topline growth, even as things like our local incomes trailed the nation, our unemployment rate was higher, etc. In recent years it has been the opposite, where our topline growth is not a national leader (and recent payroll jobs data says we lag nearly every other state, a topic we will circle back to for our forecast), but these employment rates, and household incomes for Oregonians are better than the nation.
We know this cycle has been different. Oregon’s overall economic growth has been driven to a greater degree by capital investment and productivity than raw population and labor gains compared to the past. Similarly, recent economic progress is seen in stronger incomes and higher employment rates than the nation, rather than local population and employment growth outpacing most other states. This isn’t or shouldn’t be an either/or situation. We should care about having a strong local economy where Oregonians can succeed, and being a place people want to live, and being able to accommodate them by having an adequate supply of housing and the like. It’s important to follow all of these moving parts, and where growth and progress is, and will come from in the years ahead.
Leave a comment