Southwest Washington is unique. Not only is it an integral part of the Portland regional economy, but also for the State of Washington as well. Like many suburbs, the area has been growing faster for decades, and has outpaced regional and statewide trends. In 1970, Clark County was about 12% of the Portland metro population and nearly 4% of Washington’s. In 2022, Clark County was 21% of the Portland metro population and nearly 7% of Washington’s. While this has certainly been a long-run trend, there are a few periods worth pointing out differences. From about 2005 to 2015, Clark County was a steady share of the Portland region in large part due to the housing bust and initial recovery from the financial crisis was driven by the urban cores in large cities nationwide. And then in recent years, Clark’s relative growth has widened compared to the region, and the State of Washington where it has been the state’s fastest growing county from 2020-2023.
You hear a lot of stories about why. Any single explanation is incomplete, and I cannot do them justice here. We know that the Portland regional economy has done very well over recent decades, and Southwest Washington is an important part of that. Suburbs tend to grow faster, especially those willing to build housing. You can typically get more bang for your housing buck in the suburbs, although it usually comes with a longer commute. That becomes less of an issue as Southwest Washington’s job base grows, and WFH means some workers do not have to drive across the bridge every day. The new Vancouver waterfront has been decades in the making and is a significant regional development.
Then there is the unique border tax effect. We see this in things like vice revenues, and broader consumer and taxpayer behavior. Now, the differences in the two state’s tax structure has narrowed some in recent years. Oregon has the Corporate Activity Tax, and Washington has a capital gains tax. It will be interesting to see how these impact the border effect in the years ahead. Even so, the border tax effect still exists and is very real. Keep in mind that the biggest part of the tax advantage of living in Southwest Washington is tax avoidance, if not outright tax evasion based on the unique location. Earning and realizing income while living and working in Washington minimizes income taxes, while shopping in Oregon minimizes sales taxes. That said, Washingtonians are supposed to pay the use tax on purchases after bringing them back across the river. Such a stark difference in tax policy is pretty rare across the nation, especially within a large population area. While taxes, or public policies more broadly, are rarely the only motivating factor for businesses and households, they clearly play a role in our lives and our behavior.
With all of that said, I wanted to share a couple of graphs related to migration within the Portland metro. Note that we are currently in no man’s land when it comes to Census data. We have topline county population estimates for 2023, but none of the details. We get the topline 2023 ACS published tables in September. That means we are still working with the 2022 ACS microdata, which was just released a few months back. When it comes to this data, we are able to look at people within the four major counties in the metro: Clackamas, Multnomah and Washington counties in Oregon, and Clark County in Washington.
This first chart simply looks at the number of people living in the Portland region, and moving across the river in either direction. You can see that in most years, we see net northern migration. This is true at the statewide level where Oregon consistently sees negative net migration with Washington, primarily due to these within PDX patterns. That said, the net migration numbers tend to be relatively small, maybe a couple thousand people. That changed in the 2022 ACS data where we see a large increase in those moving from the Oregon side of the Portland metro to the Washington side.
(Note that the 2022 ACS data show here shows much larger migration to Clark County than the 2022 Census county population estimates. In the new 2023 county estimates, Clark’s growth holds steady, while Oregon losses get smaller. How that will show up in the 2023 ACS data late this year, particularly on intraregional migration I do not know.)

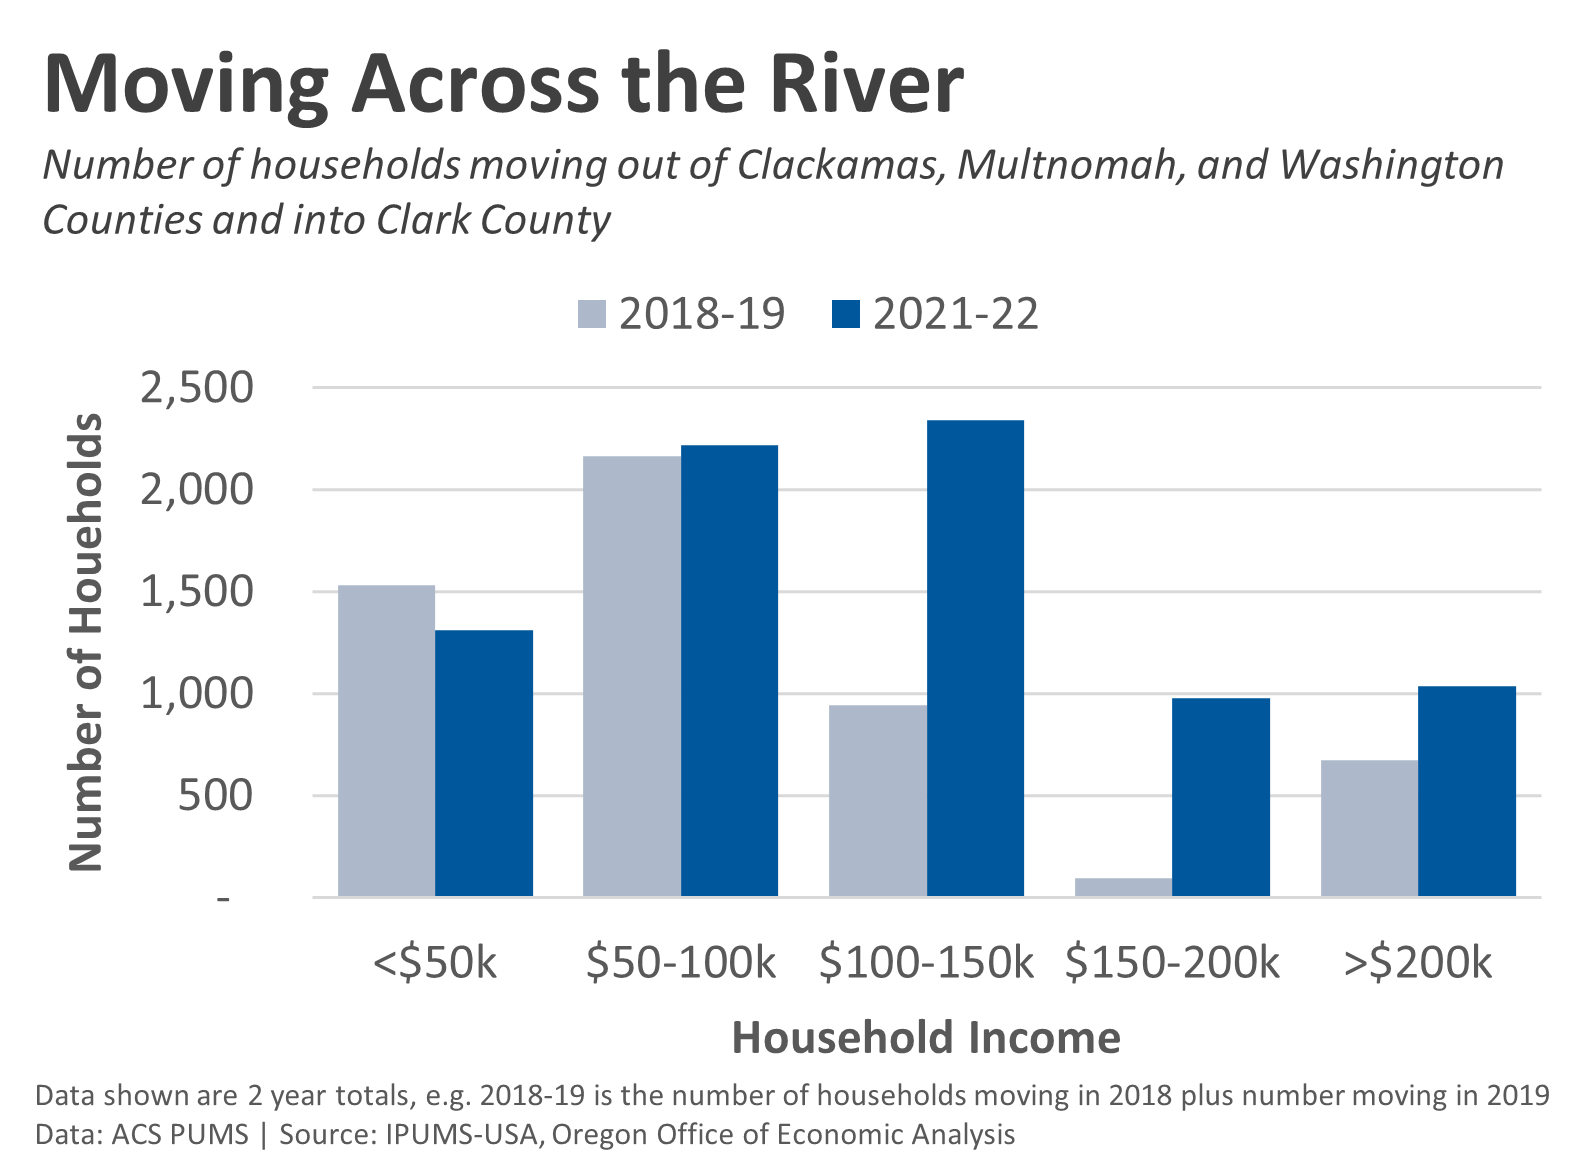
Similar to our previous look at the relative housing costs of where former Oregon households moved to, I was curious about just who was moving across the river. To help with sample size concerns, I combined two years of pre-pandemic data, with the two most recent years available. The chart below shows the household income of those moving within the Portland metro, but from the Oregon side to the Washington side. What the data show is that the increases are in most income tiers, but primarily driven by those in the upper middle income brackets of $100,000 to $200,000, and not just among the very high income bracket.
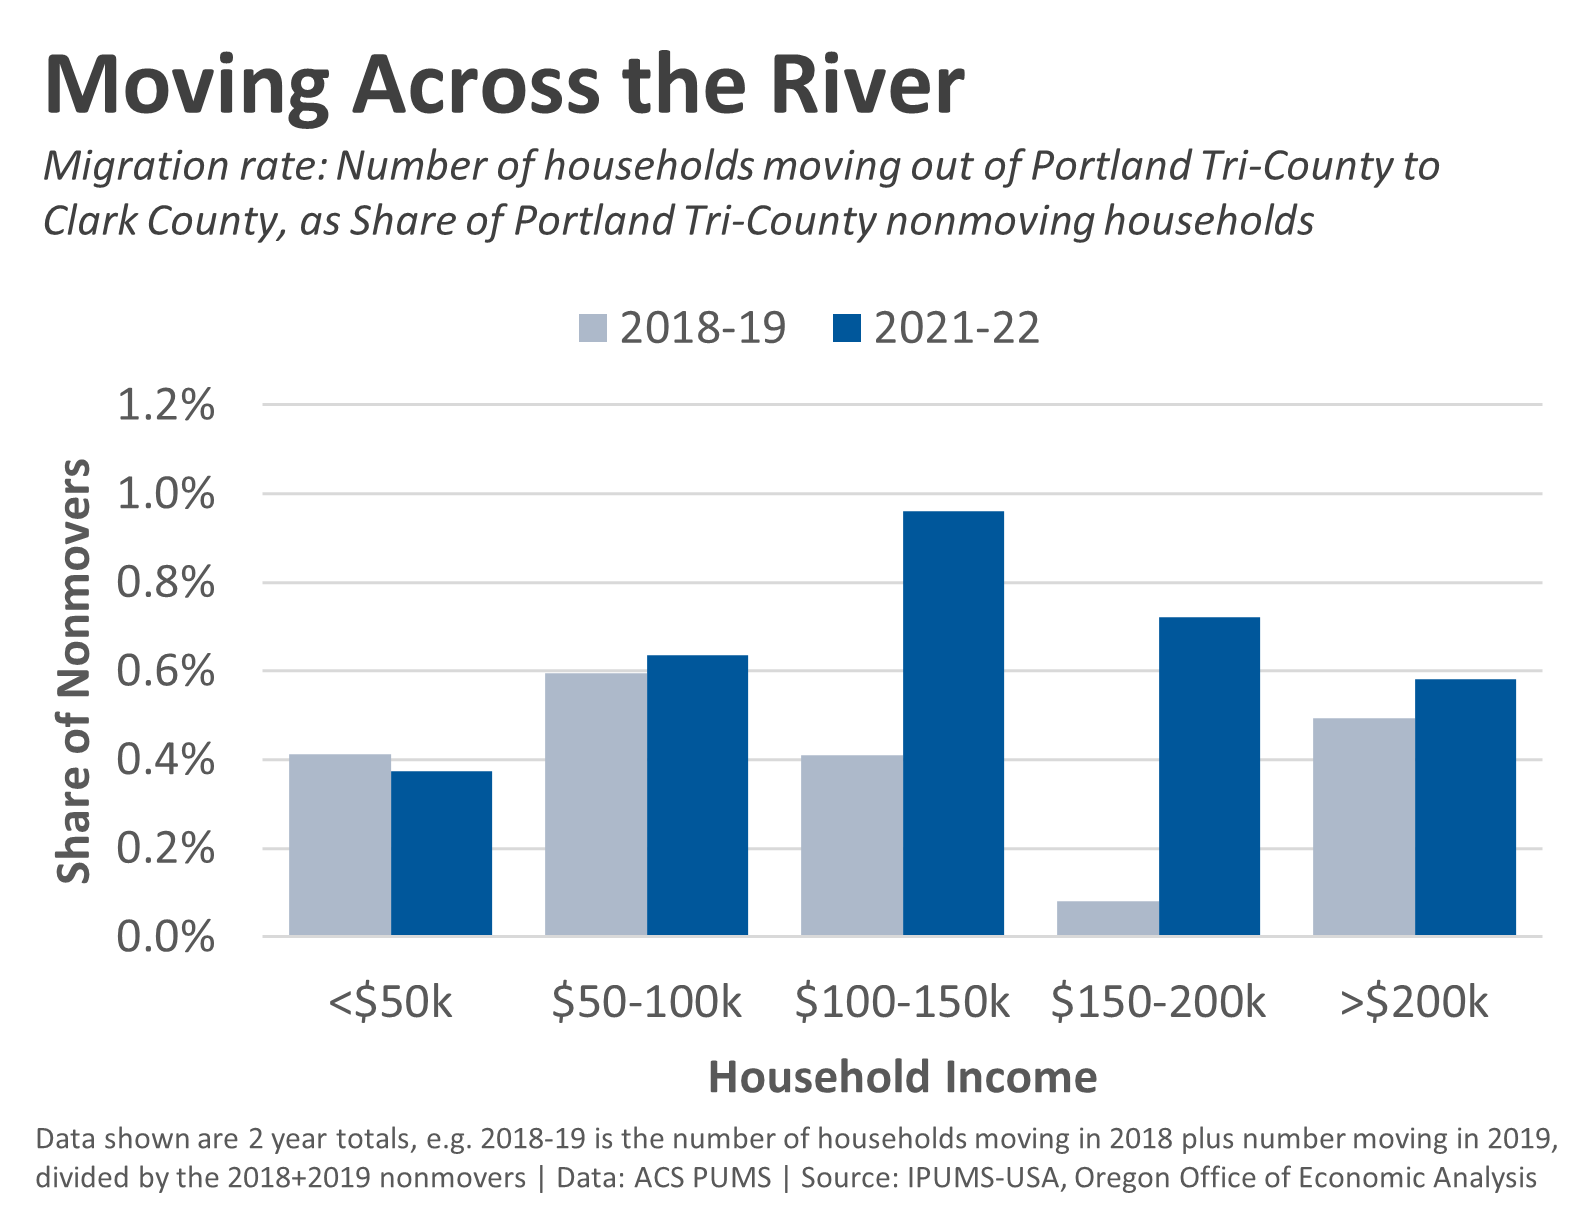
Update 4/18/24: Looking at not just the total number of households, but also the migration rate is important to consider. Thanks to Bill in the comments, and a few of you all have asked as well, here is what the migration patterns look like as a percentage of the nonmoving households. You can see the biggest increases in the migration rates are among households with incomes of $100,000-$200,000. Note that pre-pandemic, the very high income households did show a relatively high migration rate. That rate did increase a bit in recent years, but is not nearly as large as the changes seen in that $100-200k range.
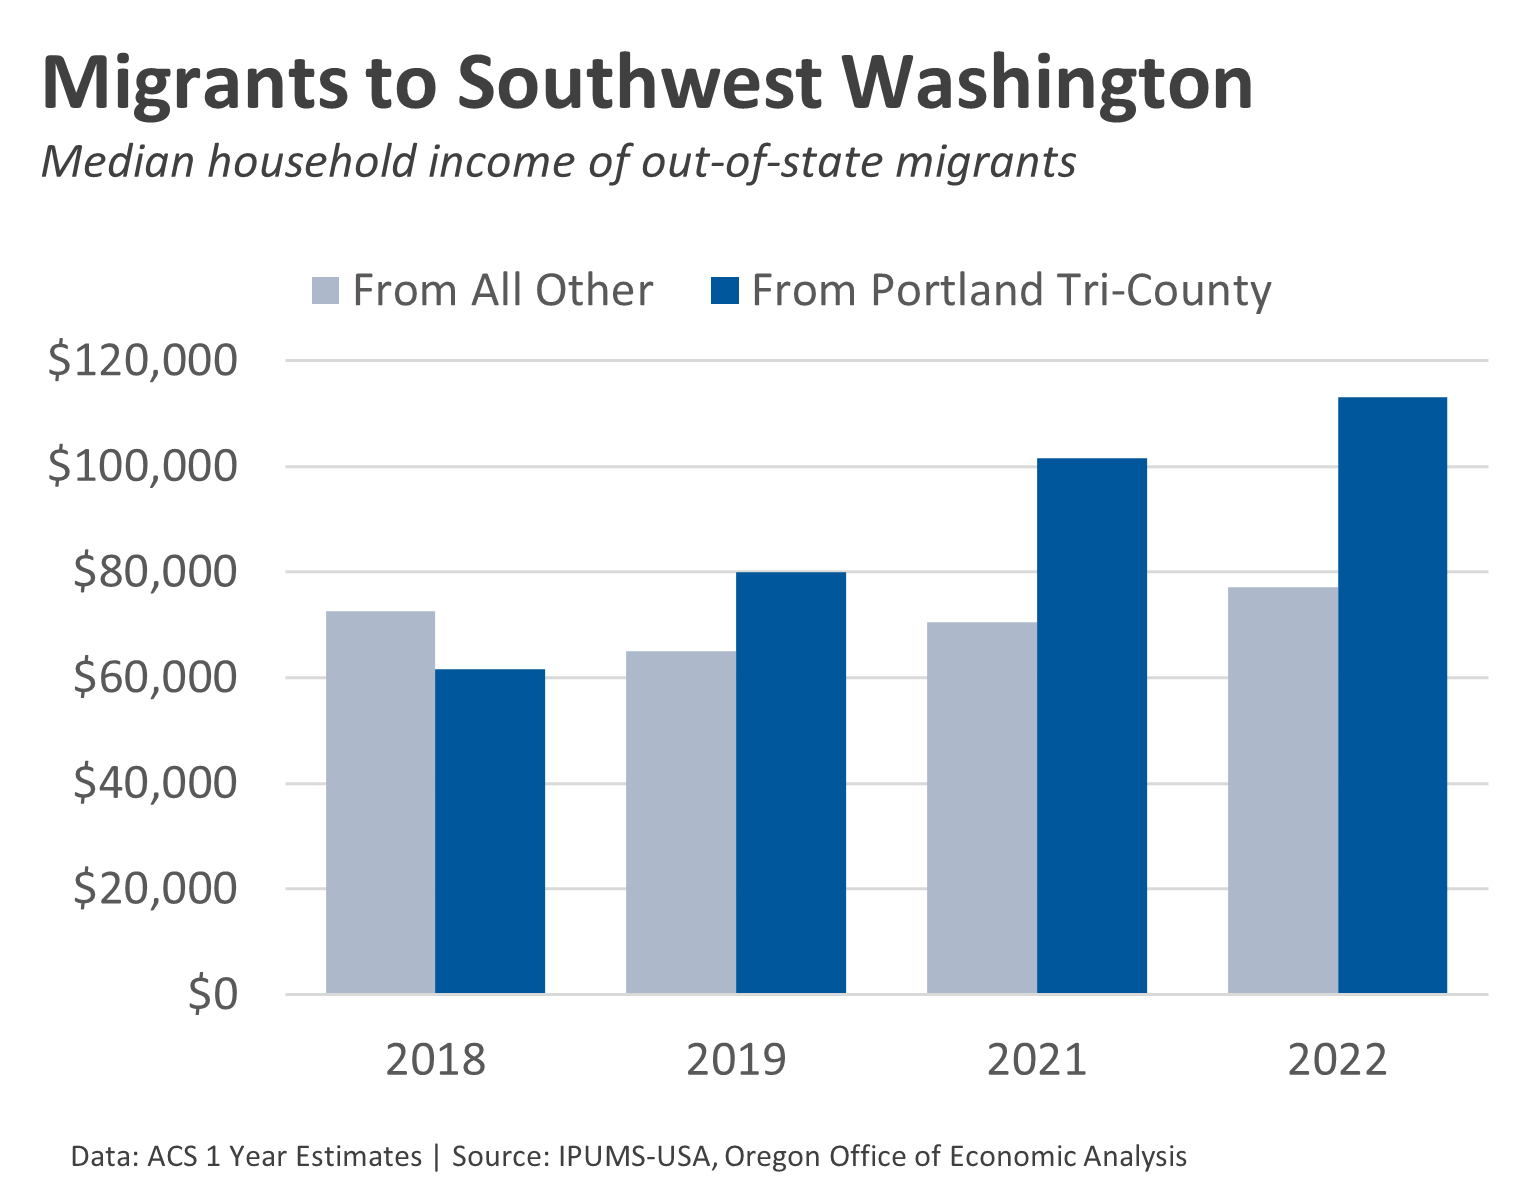
Certainly part of the increase in higher income households moving could be due to the economy and generally rising incomes. But if we compare the median household income of folks moving into Clark County, we do see that the rise in former Portlanders on the Oregon side of the river is not matched by similar income gains among everyone else moving into Clark County. The data do show a difference in these income and migration patterns.
Bottom Line: We don’t fully know the reasons why people move. We know humans are complicated, and one definition of economics is constrained optimization, or trying to do the best possible given all of the various variables impacting us. But economists tend to be believers in watching what people do more than listening to what they say. And the data show that Southwest Washington has boomed both as a share of the Portland region, and the State of Washington. Given it is literally in a different state, Southwest Washington should not really impact a lot of what our office does. However, given it’s importance to the Portland region, and the fact there are a lot of residents working in Oregon and paying income taxes, these trends and impacts are very much worth paying attention to. Our office will update these numbers when the 2023 microdata become available near the end of the year.

And many of these higher income folks who move over there are cheating….they ‘pretend’ to live there but remain here. And ODOR does not chase them.
By: Randy Miller on April 11, 2024
at 12:18 PM
Interesting. For the commenter, you live in Vancouver and get paid out of Portland, you’re pretty much the full ride on INCOME taxes – Which Clark doesn’t have. Then again, there’s a reason there’s a CostCo by the airport just off the 205 bridge since we don’t have sales tax (uet).
Be more curious on your guess of WashCo vs MultCo. Gotta think WashCo is going to pass MultCo one day since they have the jobs and none of the “only the rich” taxes MutlCo/CoP have.
By: Portland Apartment Sales on April 11, 2024
at 2:33 PM
I think its interesting to watch both retail in SWWA (increasing due to population) and in North Portland (hayden island closures), and what impact that has on the border tax effect moving forward. It will always exist, if for no other reason than some folks work in the other state and will buy things on the way home from work, etc, but is the border tax effect getting smaller over time?
It’s certainly possible Oregon could eventually see Washington County being the most populous county. But the current differences are still really large with Multnomah around 800,000 and Washington around 600,000. Even with fairly strong assumptions about growth and decline, it would take a decade or two at a minimum. An additional dynamic is we don’t fully understand all of the migration patterns. How much is due to the pandemic (public health or school closures or something), how much is due to taxes, how much is due to working from home, etc. Unlike historical examples elsewhere in the country, the out-migration is not about the loss of jobs. This is different. The jobs are still here.
By: Josh Lehner on April 12, 2024
at 1:32 PM
How can you write this piece without mentioning the PSF/SHS taxes in the Portland area?
I also find it weird that you claim some people are committing tax evasion. Do you have data to back up that claim?
By: Jmartens on April 12, 2024
at 11:41 AM
Hi J,
There is a whole paragraph on the border tax affect. Local taxes are very much a part of that. Tax evasion occurs when someone purchases goods in Oregon, and does not pay the Washington use tax after driving back home. When I worked in SWWA, there were regular media stories about law enforcement checking license plates/car registrations at school drop offs as it is less expensive to purchase and register a car in OR than WA, but you have to register it in the state in which you live. That is tax evasion. And the border tax research, some of which is linked in the post, clearly shows there is a retail sales impact, indicating tax evasion is prevalent.
Best,
Josh
By: Josh Lehner on April 12, 2024
at 1:09 PM