This morning the Bureau of Labor Statistics released the 2023 occupational and wage data for the nation, states, and metro areas. These data are for May of each year, so we can get a detailed look at the occupational employment patterns as of May 2023. The high-level summary looking through the job polarization lens is as follows. For more on job polarization you can see our office’s initial report here, and there are near-annual chart and data updates here on the blog.
We know the pandemic is different from recent cycles. It was not an economic cycle per se but rather a public health crisis that impacted the economy. Unlike in the dotcom bust or Great Recession, the job losses were not primarily middle-wage jobs. Rather, most pandemic job losses were in front-facing industries, which have a lot of low-paying occupations.
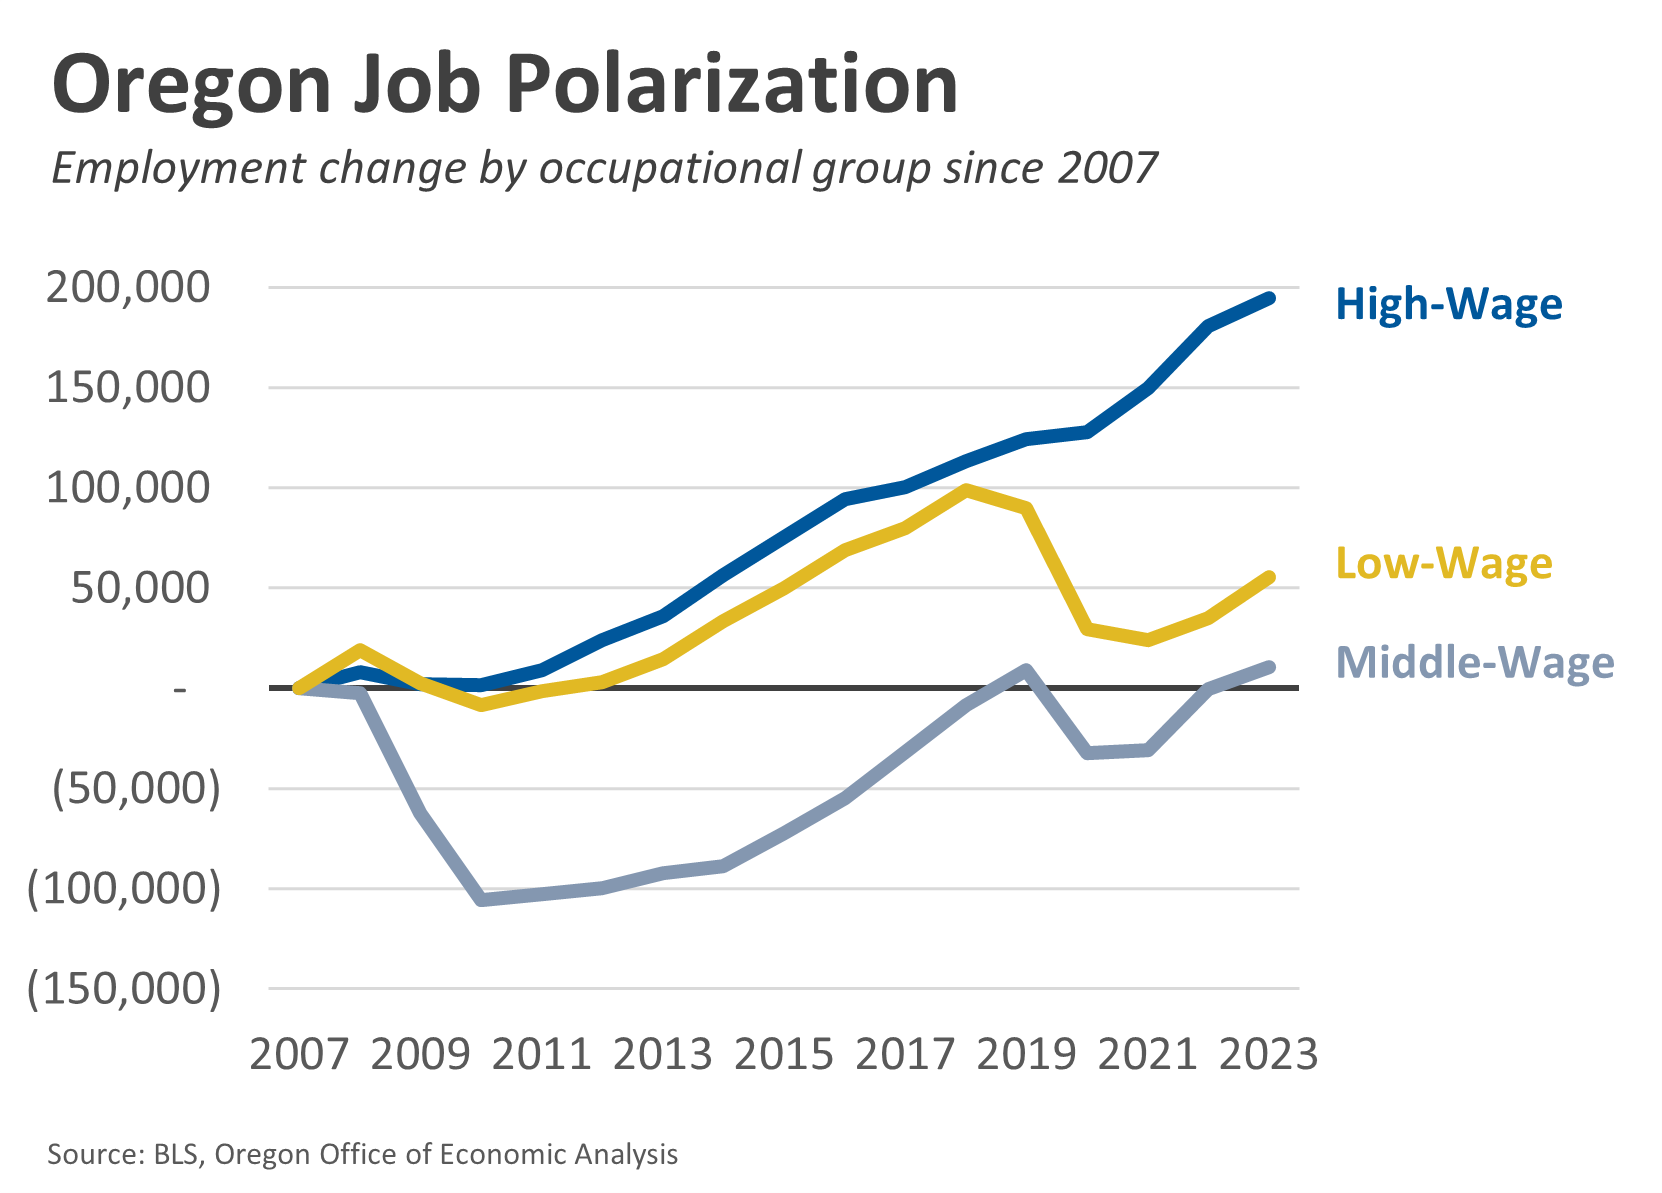
Two things really stand out to me in the new data. The first thing is that these low-wage jobs are not back. The 2023 increases were much smaller than I anticipated. The same is true nationally, but the low-wage jobs rebound nationally is stronger than the Oregon one. In the payroll survey, Oregon’s employment in industries like retail, leisure and hospitality, and other services were not fully back as of May 2023 either, but the gaps were smaller than those seen here in occupations like food prep and sales. The industry numbers were a few percent below pre-pandemic readings, while the occupational numbers are more like 5-10% lower. Now, this could just be a timing/data discrepancy. However, it could also point toward occupational shifts within industries as firms’ staffing patterns changed either due to operational changes, out of necessity given the tight labor market, or simply they have been unable to hire workers at a competitive market wage and are making do with the staff they do have.
The second thing is that middle-wage jobs are now at an all-time high in Oregon. The middle-wage job recovery from the 2001 recession took 7 years, while the recovery from the Great Recession took 12 years. The pandemic essentially took 3 years (technically 4 given how the data is for May of each year so we are comparing May 2019 to May 2023). More on middle-wage jobs in a minute.
Additionally, high-wage jobs have continued to grow the entire cycle, as we know working-from-home helped minimize job losses early in the cycle.
I want to focus on middle-wage jobs for a moment. I know the term became a buzzword last decade. The definition can be a bit squishy and means different things to different people. For our office, it comes from the original job polarization research that focused on routine occupations, or those potentially more susceptible to automation and technological change. These routine occupations also tended to fall in the middle 50% of the wage distribution as well, with roughly 25% of jobs being low-wage and 25% being high-wage. These percentages do shift around a bit over time given economic changes, and the erosion of middle-wage jobs (now 46% of Oregon jobs) is a big concern, particularly for workers without college degrees.
Now, the pandemic has been different. Middle-wage jobs did decline initially but less than in past recessions and have now fully recovered. That’s great news overall. But something that stands out to me within these occupational groups is a really stark difference between different types of jobs. In particular, classic blue-collar occupations like construction, installation/maintenance/repair, production (manufacturing), and transportation and material moving have increase substantially. Looking at the 2022 ACS data, 84% of these occupations in Oregon are filled by men.
On the other hand, classic middle-wage jobs that are primarily filled by women have declined and not recovered. Educators (70% female) is more or less steady, albeit still below pre-pandemic numbers, which is similar to the K-12 education payroll employment (and enrollment) data. Office and administrative support jobs (also 70% female) are down 6% (14,150 jobs) and show no recovery. This could be another place where WFH is having a structural impact on the economy. For more, see our previous work on how the decline of office support jobs for women matched the decline of production jobs for men.

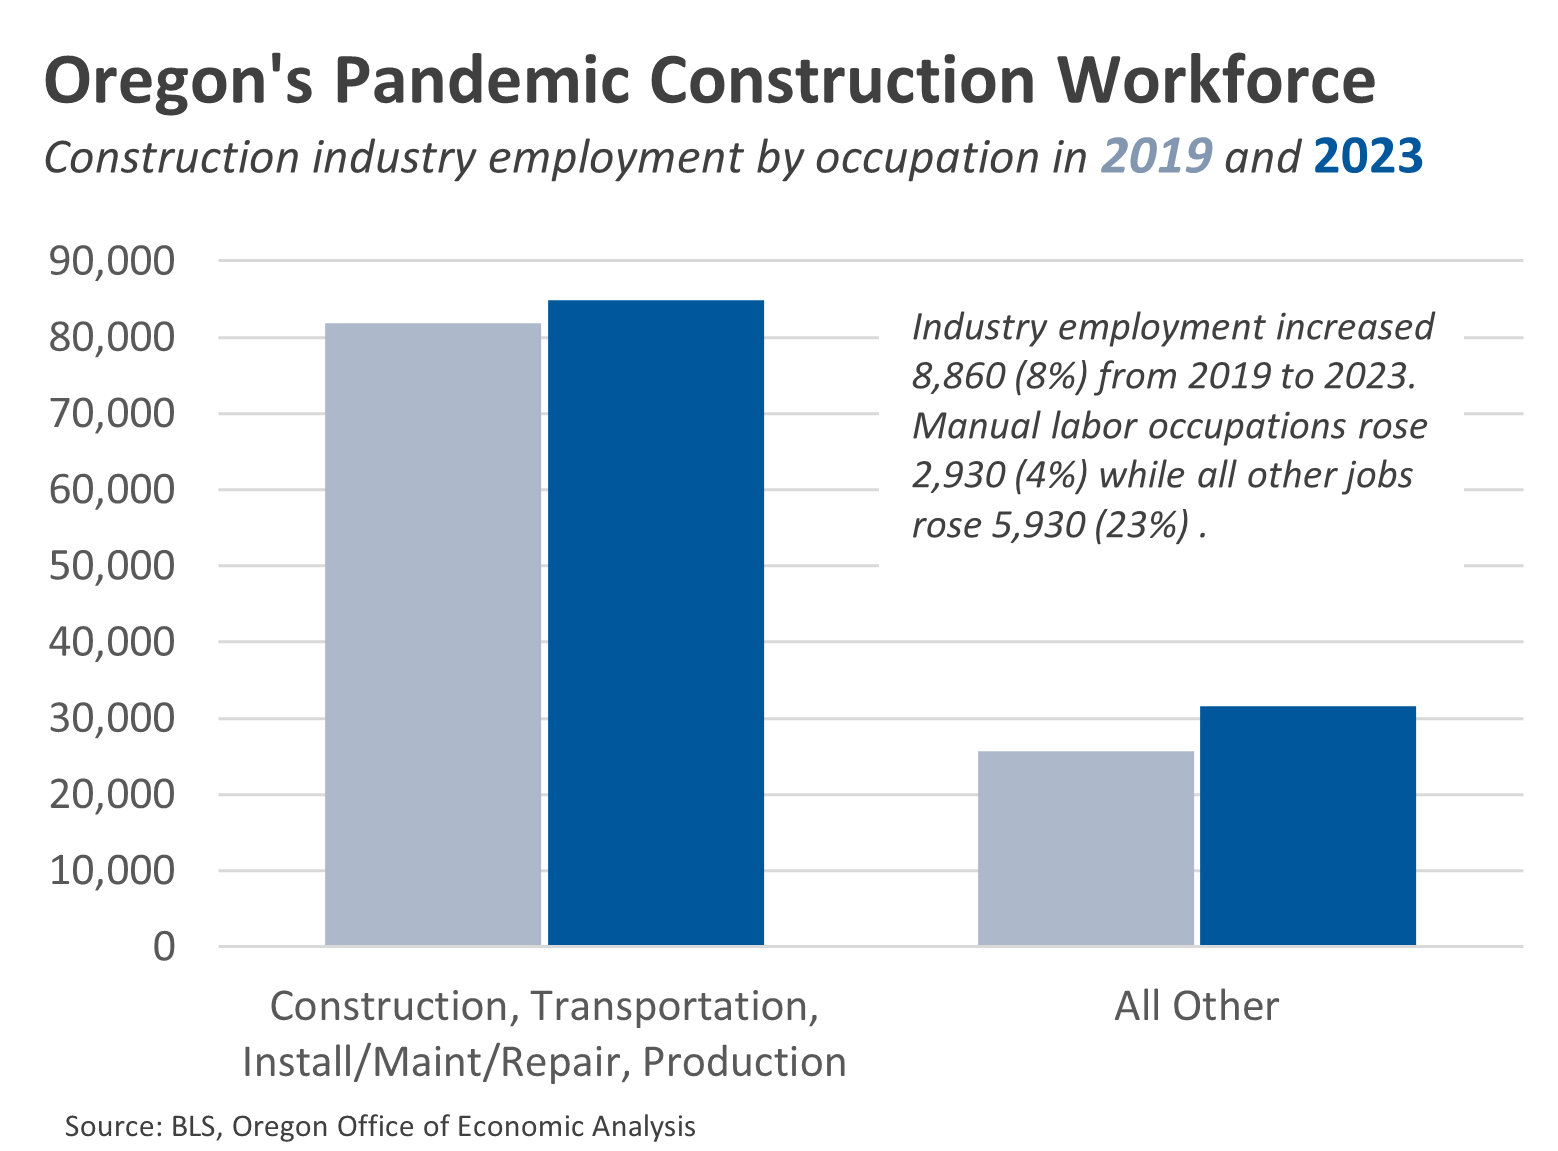
When it comes to construction, our office has written quite a bit in recent years about the industry and the need for more workers to meet the demand when it comes to increasing new housing construction, building infrastructure projects and business expansion plans like the upcoming semiconductor investments. What we see in this new data today is the continued, ongoing occupational shift within the industry. Yes, the number of jobs is up, but the bulk of those job gains are not in the trades but rather in office-based staff.
Specifically, the number of Oregonians working in the construction industry in a construction occupation is essentially flat, although there are gains in the installation/maintenance/repair occupations which are also part of the trades. Even so, the vast majority of the industry employment gains in recent years are in management, business and finance, and architecture and engineering occupations. To the extent this increases the productive capacity of the industry by being able to design and manage more projects, this is great news and hopefully pays dividends in the years ahead. To the extent this trend is construction firms becoming more vertically integrated by bringing more business and design staff inhouse as opposed to contracting with outside firms, that could be good for operational efficiencies. But to the extent this trend is more about lower productivity, or things like increased time required to obtain permits for projects, then it is likely bad news not just for the firms but also the economy given the needs and demands for more construction activity.
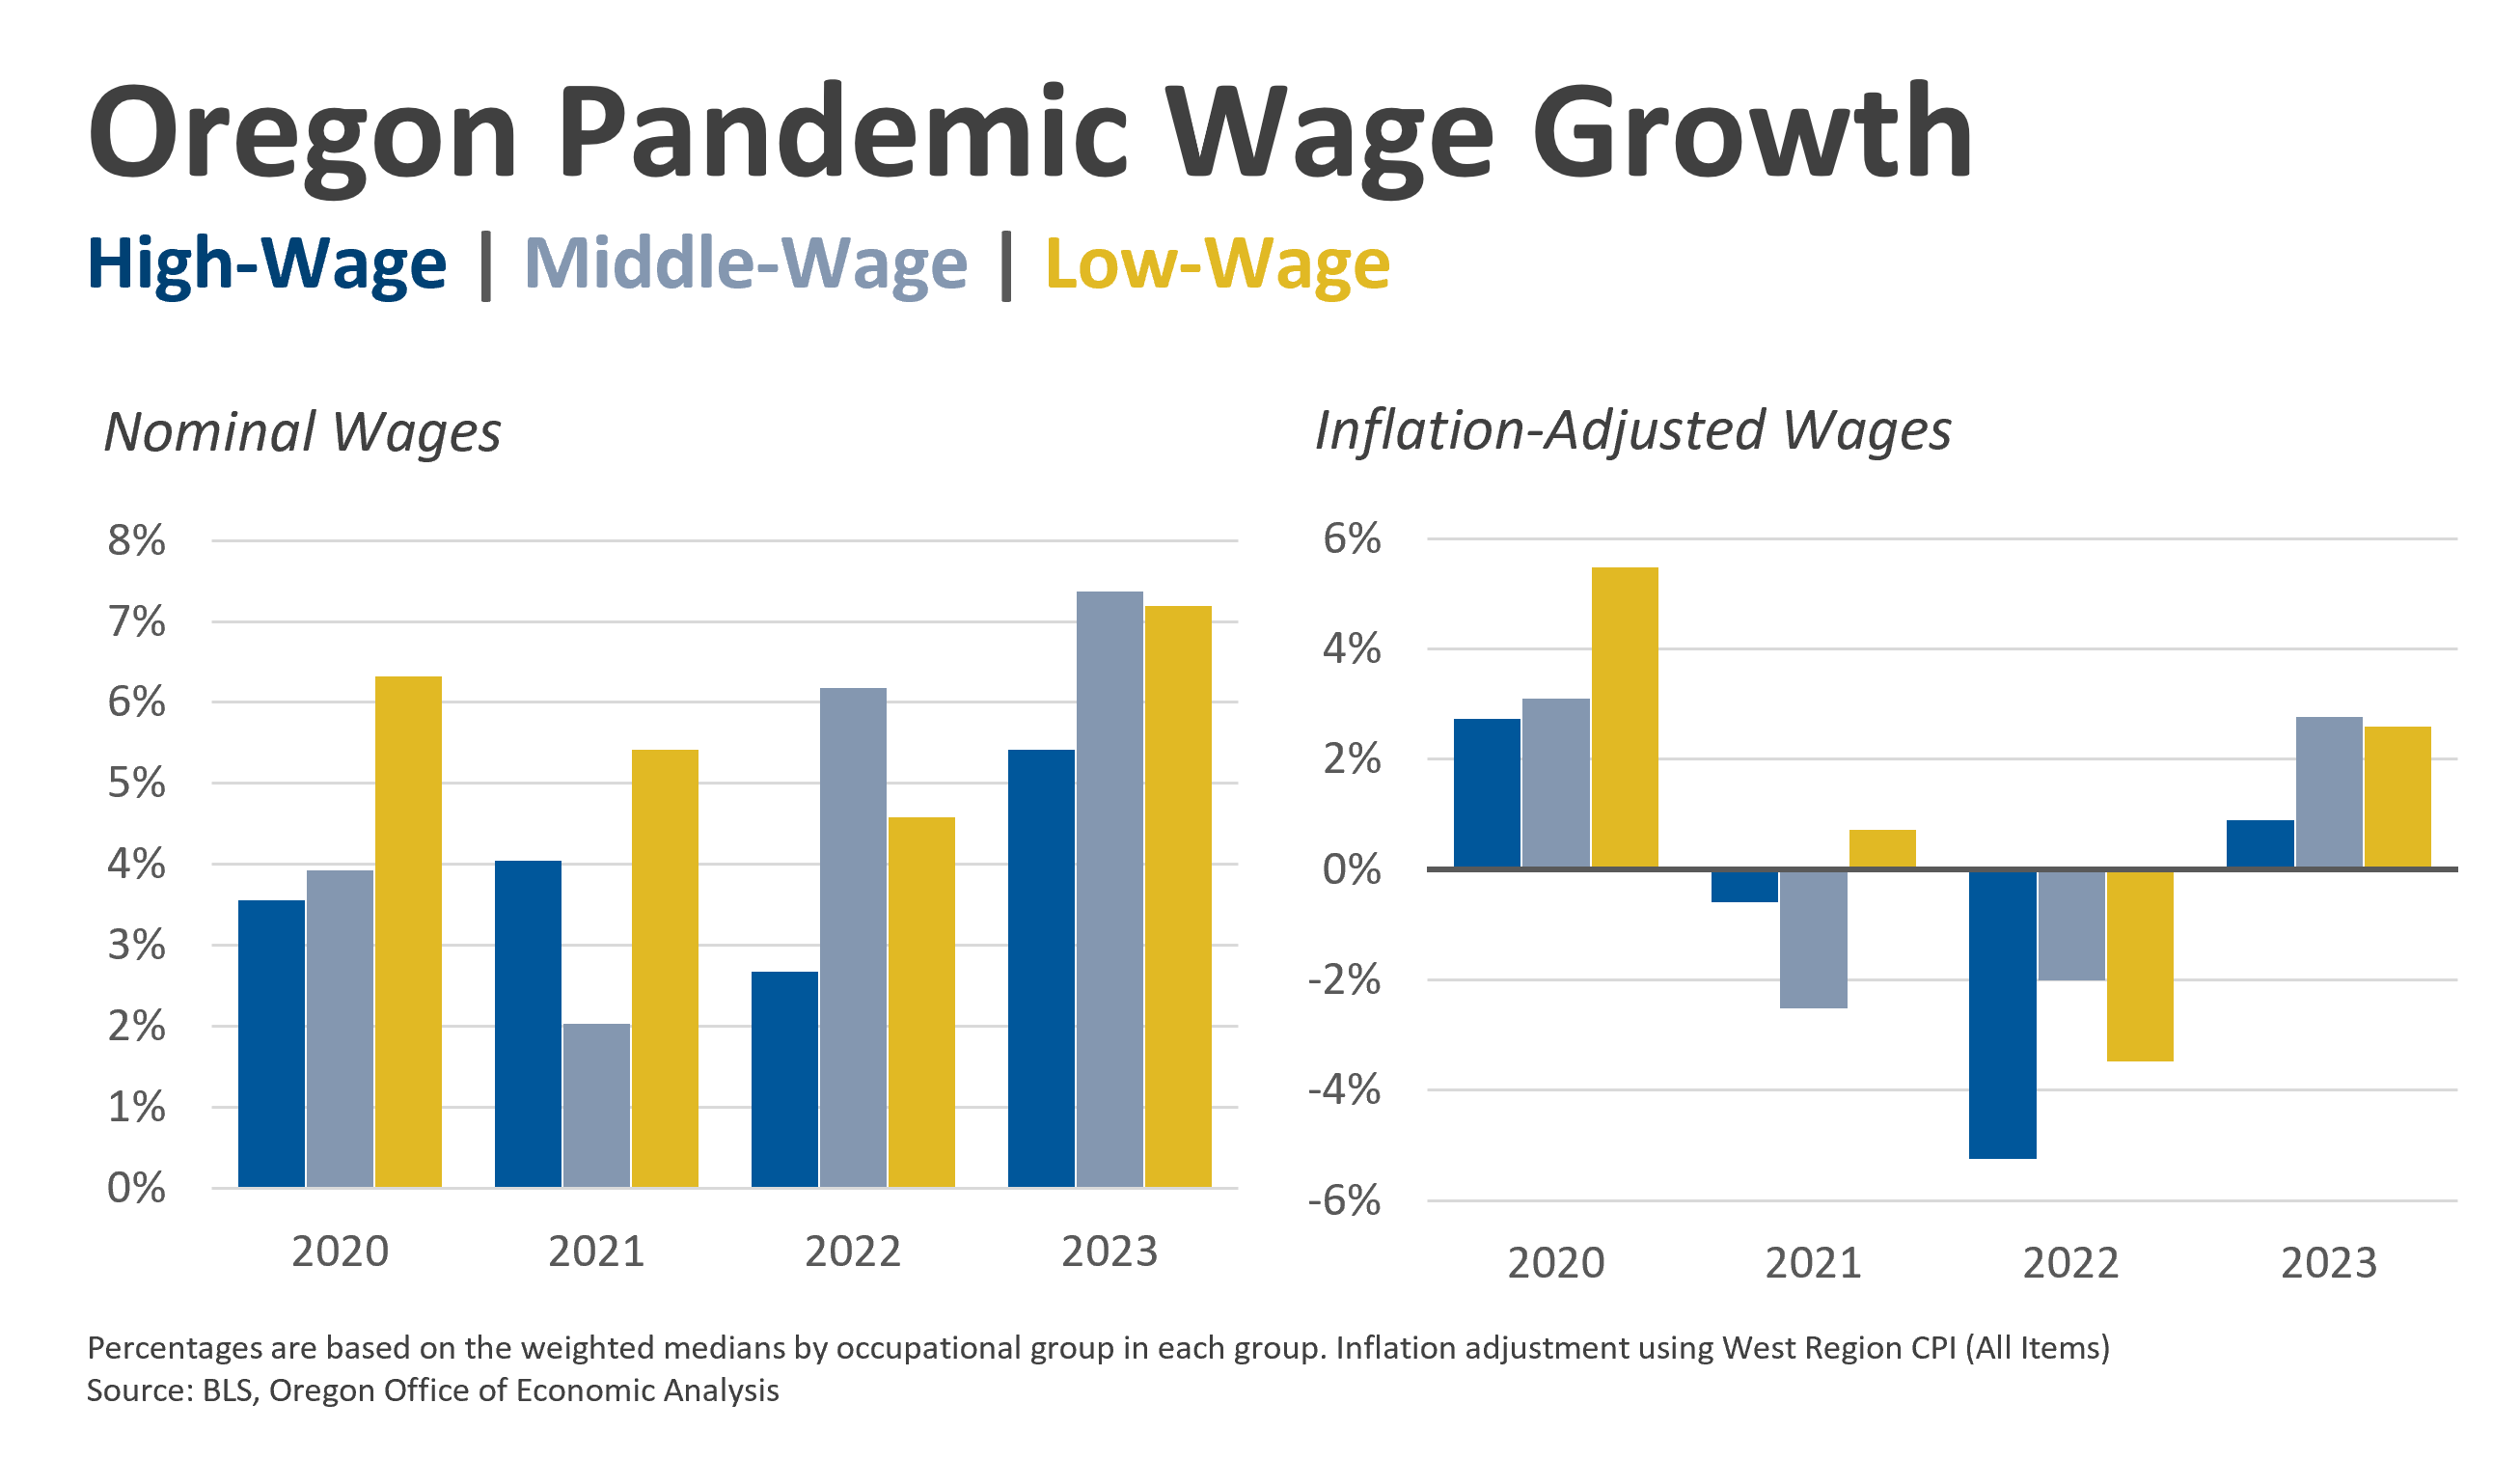
Finally, let’s take a look at wages. From 2019 to 2023, Oregon’s median wage increased 21.2% which is essentially identical to the national 20.7% increase. Of course we have also seen high inflation as well, with the West Region CPI (All Items) rising 19.4% over the same time period. That means the median wage has barely outpaced inflation in recent years, but it still is positive on an inflation-adjusted basis.
As you may expect, the strongest wage gains are seen among the lowest-paying occupations, while the higher-wage jobs are seeing smaller gains. This is consistent with a lot of other research in recent years. From 2019 to 2023, the median wage among low-wage jobs has risen 26%, compared with 21% gains in middle-wage jobs, and a 17% increase in high-wage jobs. These dynamics differ some each year, but the broader patterns hold up. Wage growth was strongest across the board in 2023, likely in part as workers received raises following the 8%+ inflation in 2022.
Note: BLS cautions against using these data in a time series manner, in part due to some shifting occupational definitions, and the data is meant to be a snapshot in time. I do use the data in a time series manner anyway, in part because other occupational data from places like the household survey and the ACS are in broad agreement with the trends seen in this particular dataset as well. This dataset also does have more granular details on employment and wages, and less noise due to survey sample size issues that impact the other sources for a smaller state like Oregon.

Leave a comment