Recently I was part of the Oregon Realtors’ Fair Housing Summit. Besides general outlook topics, I put together a few demographic-focused pieces that included a housing angle. These include a look at racial and ethnic diversity, same-sex households, and one-person households by age. Race, sexual orientation, and age are all protected classes by law. I have also fleshed these out a bit further in the time since. You can think of these posts as a mini-series on demographics and housing.
Over the past decade we have seen a more broad-based, and more inclusive economy than we have historically. Today’s racial poverty gap is the lowest on record, and household income growth has generally been faster among Black, Indigenous, and People of Color (BIPOC) in Oregon. These trends are interacting with, and possibly caused by the long-run trend that America, and Oregon are becoming more diverse in general. Younger generations today have much greater racial and ethnic diversity than older generations. Here in Oregon, nearly one-third of Millennials identify as BIPOC, while 4 in 10 Gen Z Oregonians do. Compare this with the 10-15 percent of older adults in the state who identity as BIPOC.
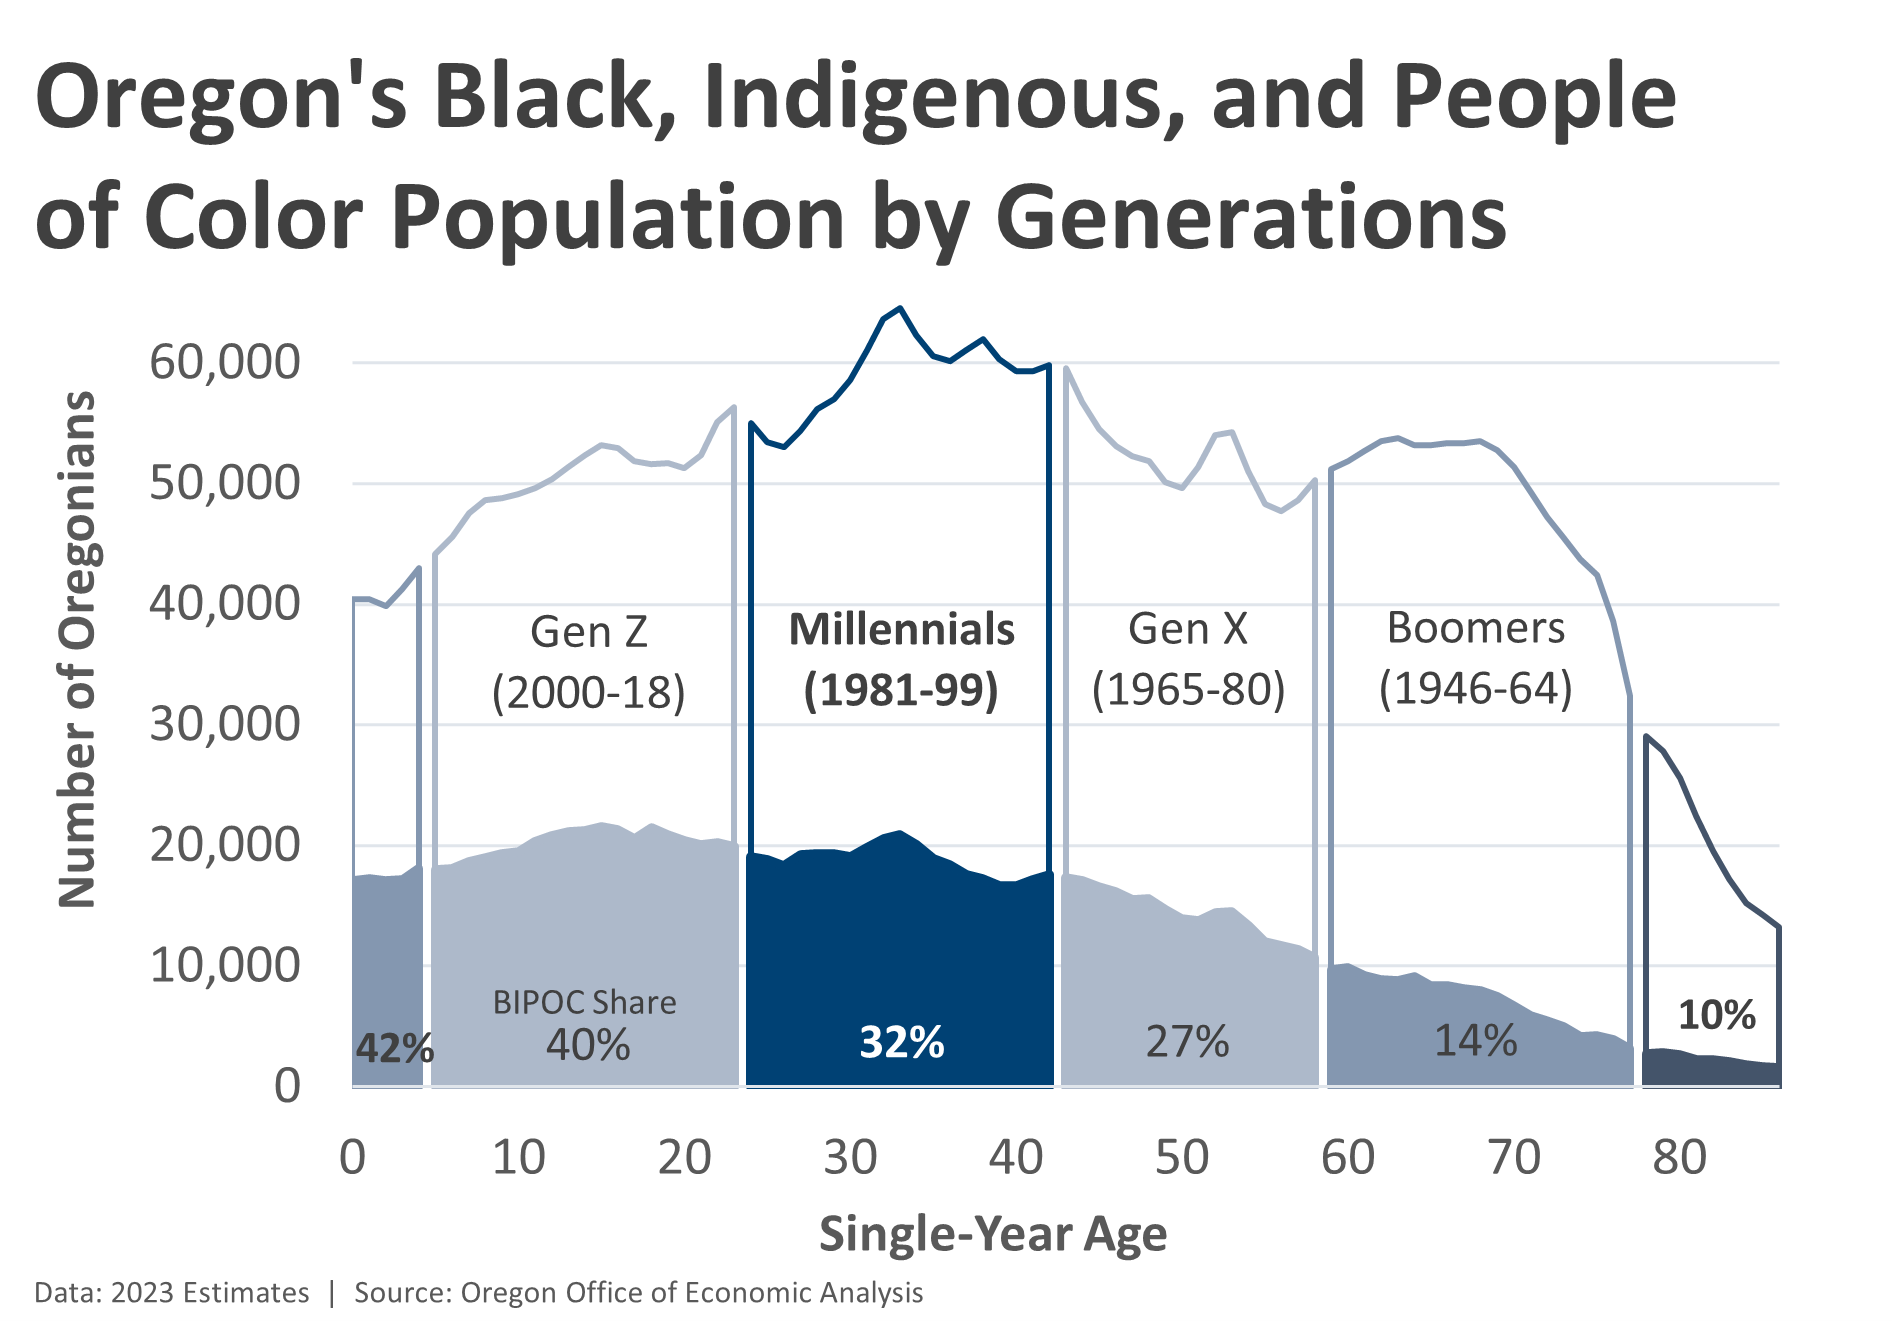
Note that Oregon is less diverse than the nation, ranking about 30th across all states based on the 2020 Census data. Even so, these same relative patterns by age are seen locally like they are nationally.
Increasing diversity, like all types of demographic change, is going to impact society and culture more broadly, but also the economy. The workforce to today and tomorrow is more diverse than the workforce of yesterday.
When it comes to housing, we know that historical disparities exist. Homeownership rates, and housing wealth, is higher for white, non-Hispanic Americans and Oregonians. However, these disparities are beginning to narrow some. As of 2022, Oregon homeowners were 83% white, non-Hispanic, or 17% BIPOC. If you look at new mortgage originations in recent years, about 25% of them are going to BIPOC borrowers. Note that 2023 state mortgage origination data will be out in a couple of weeks from the FHFA here. I will try and update this chart at that time.

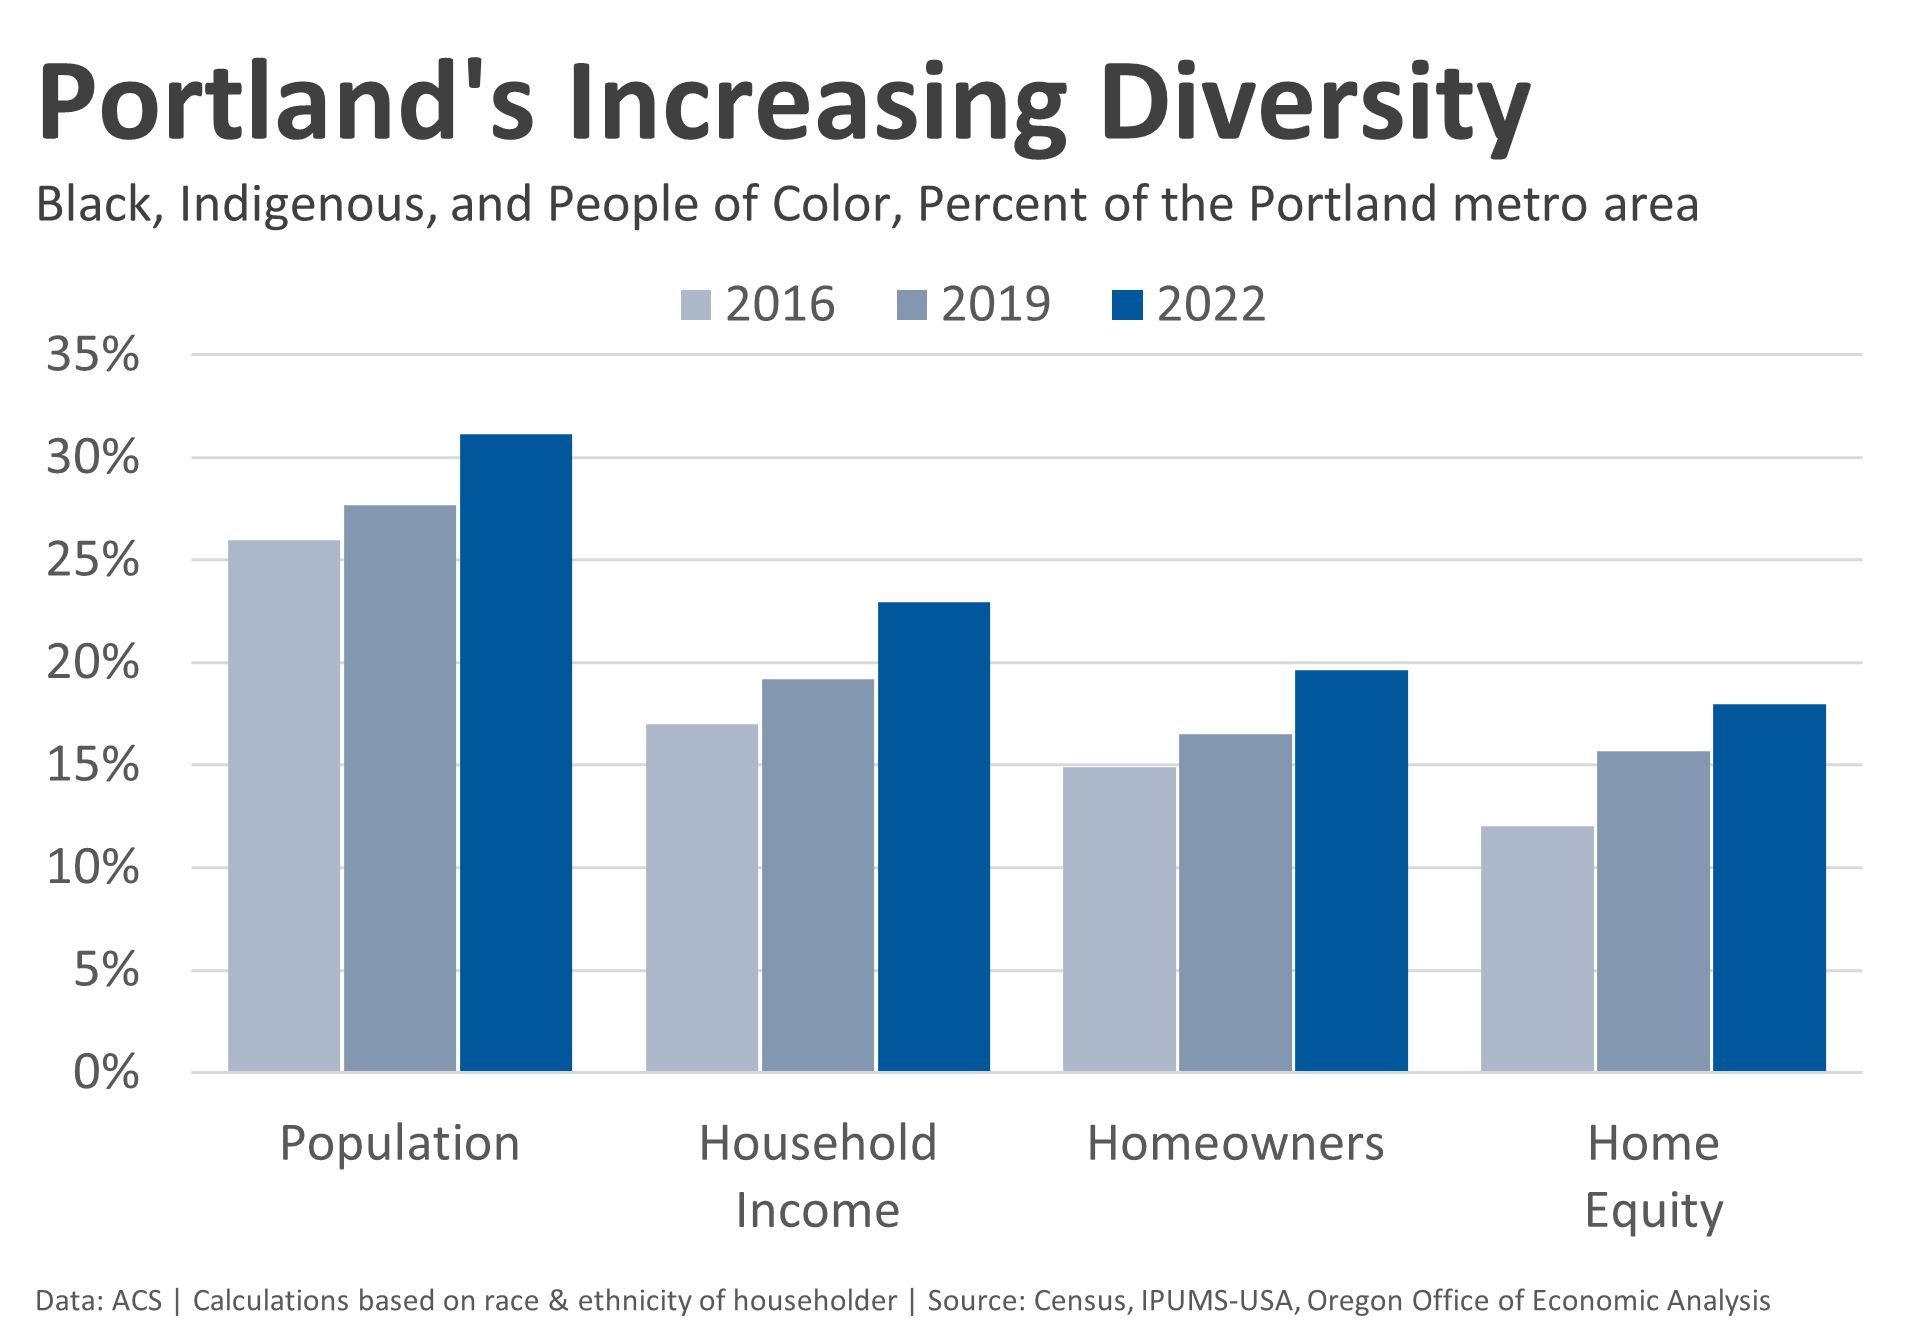
You can see this increase in economic, housing, and racial and ethnicity diversity in the chart below for the Portland metro area. When it comes to the overall population, household income, number of homeowners, and home equity (wealth), each measure is up five or six percentage points in recent years.
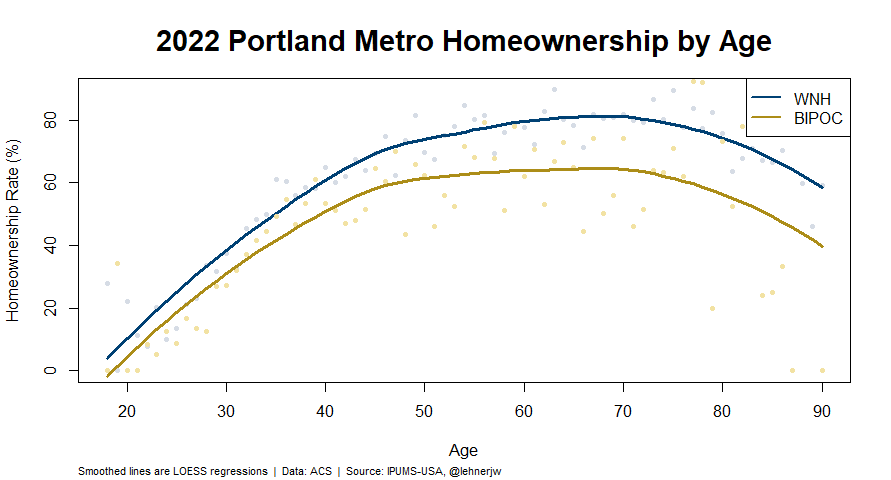
However, the racial homeownership gap remains large. This chart uses the ACS microdata and calculates the homeownership rate for each individual age, and then uses a LOESS regression to find the underlying trend amongst the noisy data.
Finally, we can compare this gap between local homeownership rates for white, non-Hispanic Portlanders and their BIPOC neighbors. When we do that in recent years you can see that the relative gap remains the same. Please ignore some of the individual data points, especially at the tail end of the curves where the sample size for homeowners by race and ethnicity at very young, and old years is small. Focus instead on the broad trends seen among the middle-age population.
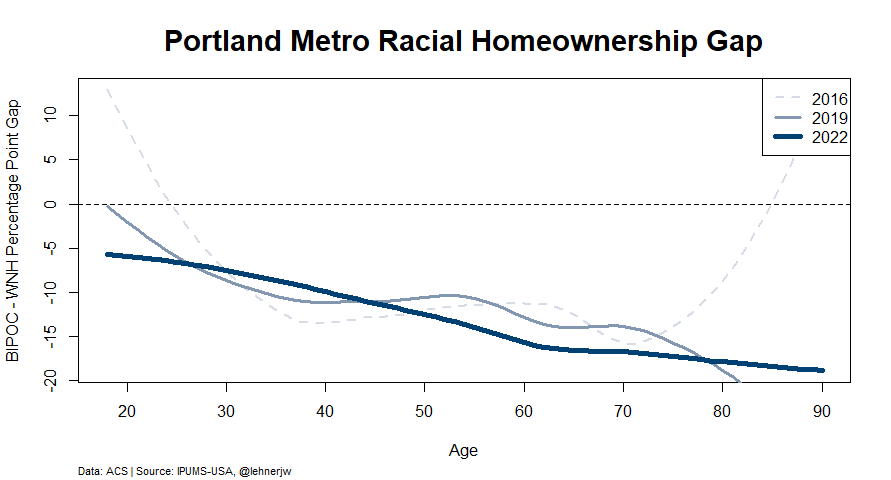
Unfortunately what the chart above shows is there is no improvement in the homeownership gap. It indicates that all of the increase in homeownership and home equity diversity is entirely about the underlying demographics, and not about reducing the within cohort gap, at least locally. Now, that is better than the gap widening. And encouragingly, it means changing demographics are filtering through into the economy and the housing market at basically a 1:1 rate. However, the lack of real, fundamental improvements is another indication that access to homeownership and wealth remains concentrated with large inequities.

Leave a comment