Recently I was part of the Oregon Realtors’ Fair Housing Summit. Besides general outlook topics, I put together a few demographic-focused pieces that included a housing angle. These include a look at racial and ethnic diversity, same-sex households, and one-person households by age. Race, sexual orientation, and age are all protected classes by law. I have also fleshed these out a bit further in the time since. You can think of these posts as a mini-series on demographics and housing.
One-person households are a rising share of our society, and housing market. We first dug into this a few years ago. At the time there were some interesting tidbits about how businesses were working to adjust their products to match shifting consumer demand. That giant, bulk package of toilet paper is not practical or needed by every household, even if you can get a cheap hot dog for lunch at the same time.
Today, given the pandemic’s impact on community and social engagements, along with our aging demographics, it seems like the conversation has shifted to be more about loneliness. The Surgeon General says there is an epidemic of loneliness and isolation in America. I am not here to discuss those issues but will make two notes. One, our household formation and composition patterns may be having an impact, or rather the trends are similar, but may or may not be causal. Two, there is a difference between being alone and being lonely. Just because someone lives alone does not mean they are lonely, although they very well may be. I have had a few conversations with cities and nonprofits in recent years regarding the potential relationship and impact of these demographic and housing trends with things like mobility, community engagement, etc.
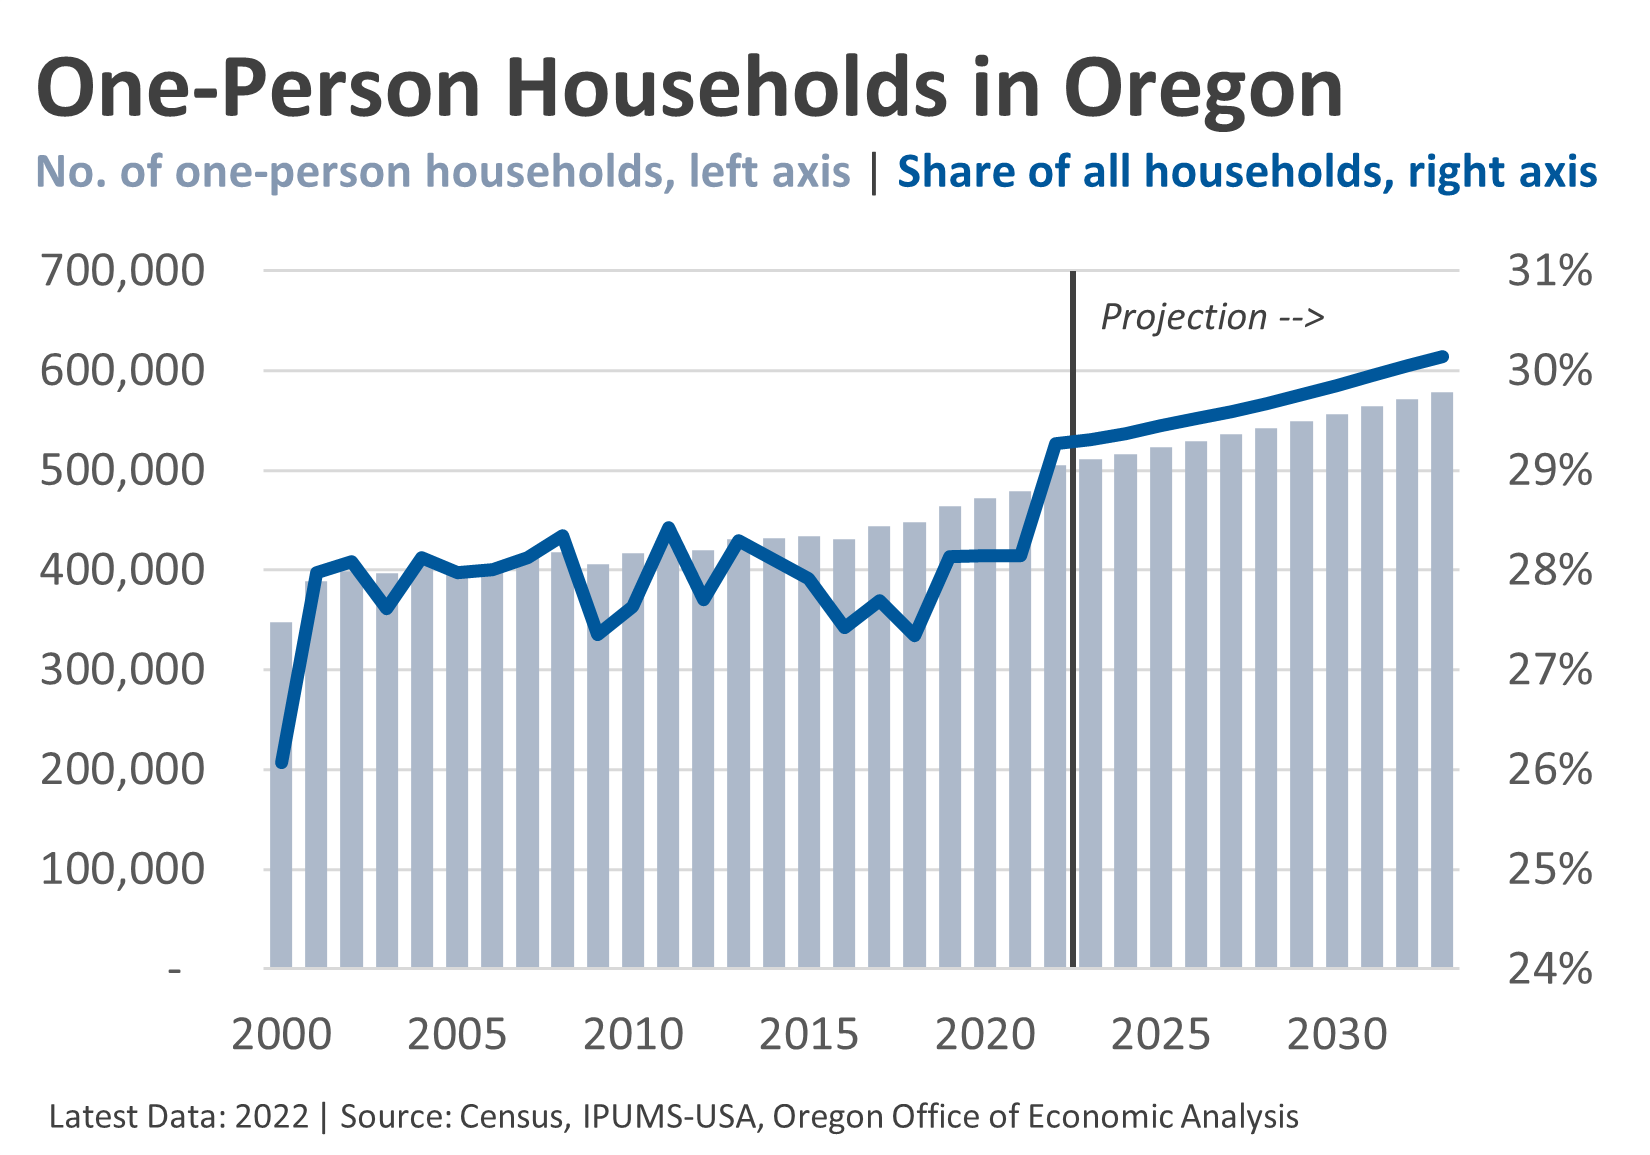
With that, let’s dive into the data. As of the 2022 ACS data, Oregon had 505,00 one-person households, which accounted for 29% of all households in the state. This is very similar to the nation where there were 37.2 million households, which accounted for 29% of all households nationwide. Both the total number, and share of all households have been increasing in recent decades, albeit slowly. Now, the Oregon numbers bounce around more than the national ones, likely due to sample size, but the longer-run trends are quite similar. (Edit: Previously it said 5 million households nationwide, which is the number of one-person homeowners aged 75 years and older. The total number is the 37.2 million.)
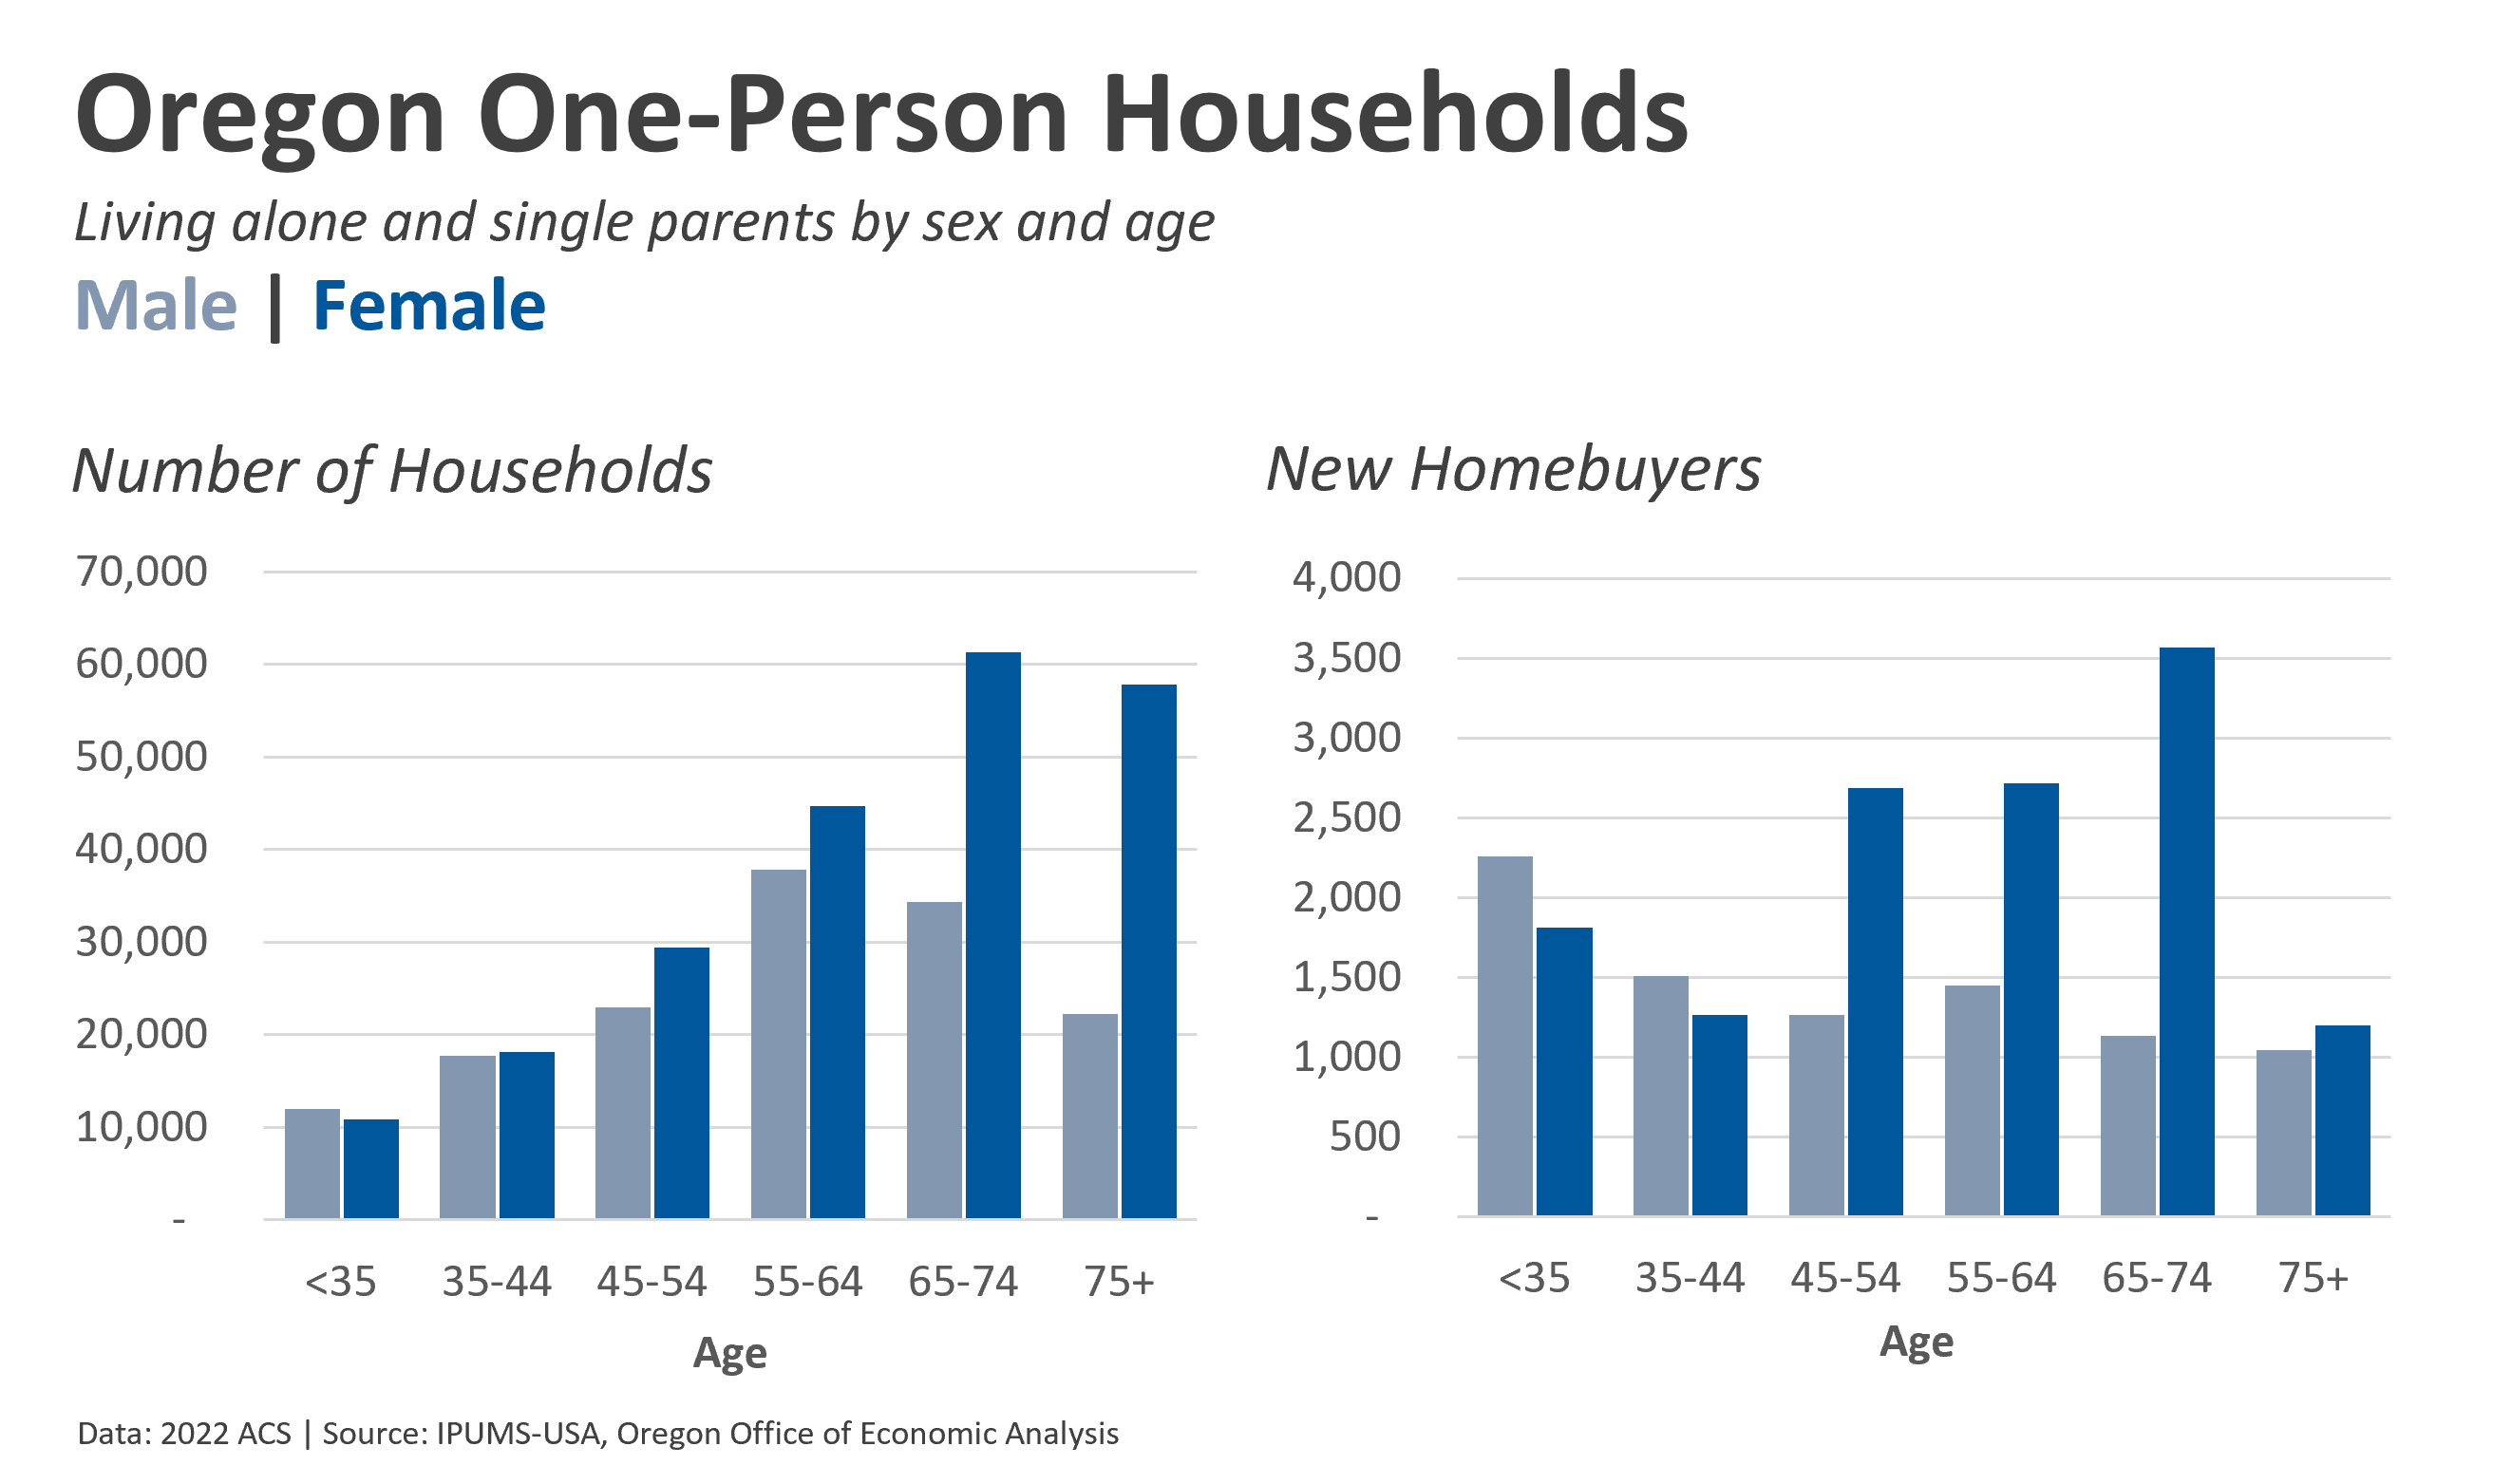
Next let’s look at the patterns of one-person households by age and the contribution to the total by sex. You can see that one-person households are less common at younger ages when most of us live with roommates, and then have a family. Males living alone are a bit more common than females at these younger ages. As we age, the share of us living in one-person households increases, driven predominantly by females. In ones 50s and 60s, divorced Oregonians are the majority of one-person households. Some of that is age-related, but also impacted by the increase in divorces nationwide a handful of decades ago. Today, marriage rates are lower, but so too are divorce rates so it will be interesting to see how this impacts household formation when, say, the Millennials reach their 50s and 60s in another 20 years or so. Lastly, as we age into our 70s and older, widows and widowers, but mostly widows are the largest share of one-person households.

Moving forward, one-person households are expected to continue to increase and at a faster rate than the overall population and household formation in general, but by just a little bit. If one-person households are 29% of all households today, they are expected to be 32% of the net household increase in the decade ahead.
There are quite a few moving parts under the surface to get at those numbers. On one hand Millennials are aging into the higher household formation years overall, but it’s primarily into their family-age years where one-person households are less common. It’s not until one’s mid to late 50s that one-person households begin to increase. A decade from now Millennials will be in their mid 30s to early 50s.
On the other hand, both Gen X and Gen Z will be the primary drivers from a numerical perspective. This is because Gen Z will transition from living at home to living on their own, of which most will have roommates, but some will not. And Gen X is now mid 40s through late 50s and will age through the large increase in one-person households in the decade(s) ahead.
On a third hand, the number of one-person Baby Boomer households is projected to be relatively constant in the decade ahead. This is due to the fact that while the share of Baby Boomer households that are one-person is expected to continue to increase, the total number of Baby Boomer households is expected to decline due to aging and mortality. The combination of a rising share of a declining total is a steady number, in this case at least. Similarly, the number of Silent Generation one-person households will decline significantly.
Finally, bringing it back to the housing market and homebuyers, the differences by age and sex are noticeable, and differ some from the conventional wisdom. The story I hear most frequently is that young, single women are an increasing share of homebuyers. And that does appear to be true. But that fact gets misconstrued in the sense that young, single men are also homebuyers, and then projecting these younger buyers onto any discussion of one-person households more broadly. The biggest gaps here between the sexes is among those of us in our middle-aged years or older. Part of that is it is expensive to buy a home, so homeownership rates increase with income, which also generally means with age, and then layer on the earlier discussions of mortality where women have a longer life expectancy than men.
Bottom Line: One-person households are an increasing share of our society, and our housing market. These trends are in part driven by broader changes related to lower rates of marriage and fertility, but more so driven by our underlying demographics of an aging population, with noticeable differences between men and women. In an upcoming piece we will touch on the potential impact here for housing supply, in terms of new listings of home for sale or rent as we age, move into residential care facilities, or pass away.

Hi Josh,
You make the statement “the nation where there were nearly 5 million one-person households, which accounted for 29% of all households nationwide”
That would mean that nationwide we have about 20 million households. There’s about 126M households nationwide per this link to the census.gov site. So one or both of the numbers in your statement can’t be true.
https://www.census.gov/quickfacts/fact/table/US/PST045223#PST045223
Just thought I’d point that out. I always finds your posts interesting.
-Eric Wagner
President
The Wagner Group, Inc.
By: eewagner@earthlink.net on March 12, 2024
at 4:31 PM
Thank you Eric! You’re right. One of those numbers is wrong and it’s the 5 million. There are nearly 5 million homeowners aged 75 and older who are one-person households. The 29% is correct, and the total one-person households is 37.2 million nationwide. Making the edit now, thanks again!
By: Josh Lehner on March 12, 2024
at 4:52 PM
Cool. It’s good to know that I can go head-to-head with the state economist and be right sometimes!
-Eric
By: eewagner@earthlink.net on March 13, 2024
at 7:19 AM