Recently I was part of the Oregon Realtors’ Fair Housing Summit. Besides general outlook topics, I put together a few demographic-focused pieces that included a housing angle. These include a look at racial and ethnic diversity, one-person households by age, and same-sex households . Race, sexual orientation, and age are all protected classes by law. I have also fleshed these out a bit further in the time since. You can think of these posts as a mini-series on demographics and housing.
When it comes to diversity in Oregon, the state’s LGBTQ+ population, as a share of the statewide population, is a national leader. This goes for data based on public polling, research coming from third party sites or organizations, and official Census Bureau data. The specific figures can be a bit different depending on the data source, but Oregon, along with our neighbor to the north, and much of New England, tend to be at or near the top when looking across all states.
What follows is a look specifically at same-sex households based on data from the American Community Survey. Our office tends to stick with official federal statistical agency data when possible. A few years ago Census added detail to their household composition questions to distinguish between same-sex and opposite-sex partners, both in terms of married couples and unmarried cohabitating couples. This means the ACS data is for couples only, and is not about the overall population per se. The good news here is that the relative patterns nationwide are quite similar to other data sources available.
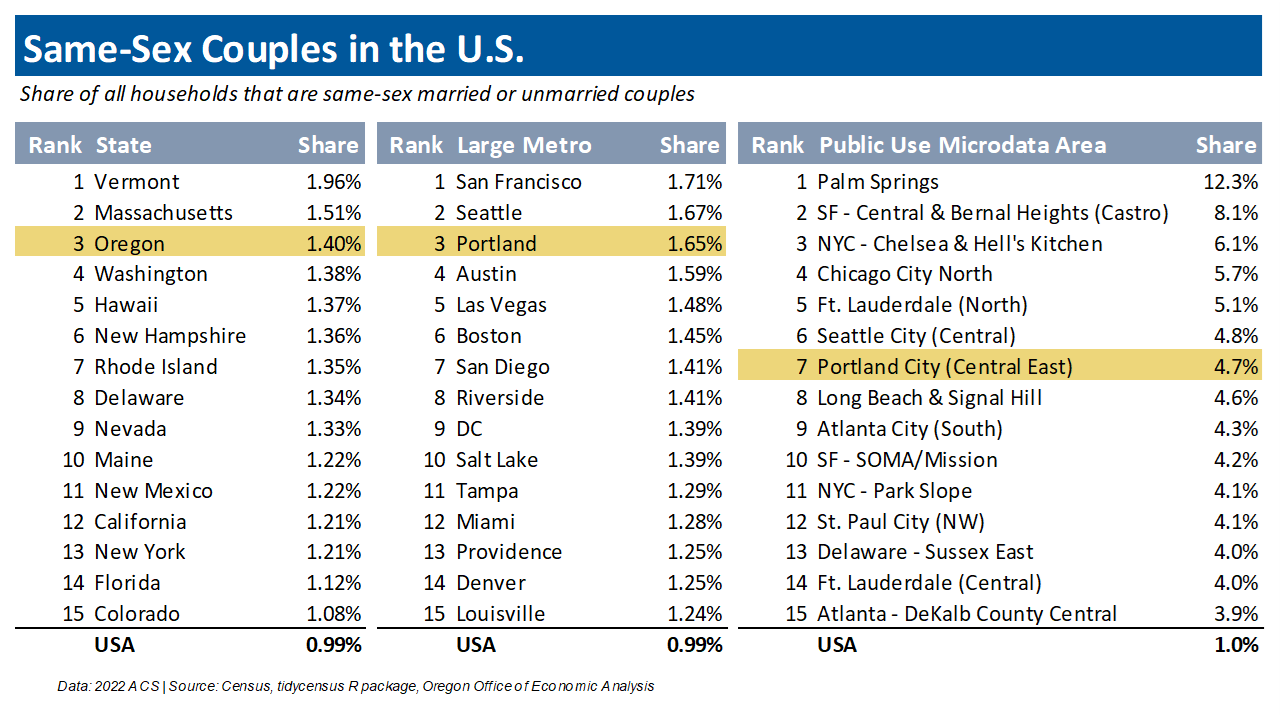
With that, let’s dive into the data. The table below ranks the Top 15 in the nation based on the share of all local households that identify as same-sex couples. At the U.S. level 1 percent of all households are same-sex couples. Here in Oregon it is 1.4 percent, ranking third highest across all states. At the metro level, with a focus on large metros with a population of one million residents or more, Portland also ranks third highest at 1.65 percent with only San Francisco, and Seattle seeing slightly higher shares. At the neighborhood level (technically the public use microdata area which is geographies of about 100,000 people), the central eastside of Portland ranks seventh highest nationwide with 4.7 percent of all households identifying as same-sex couples.
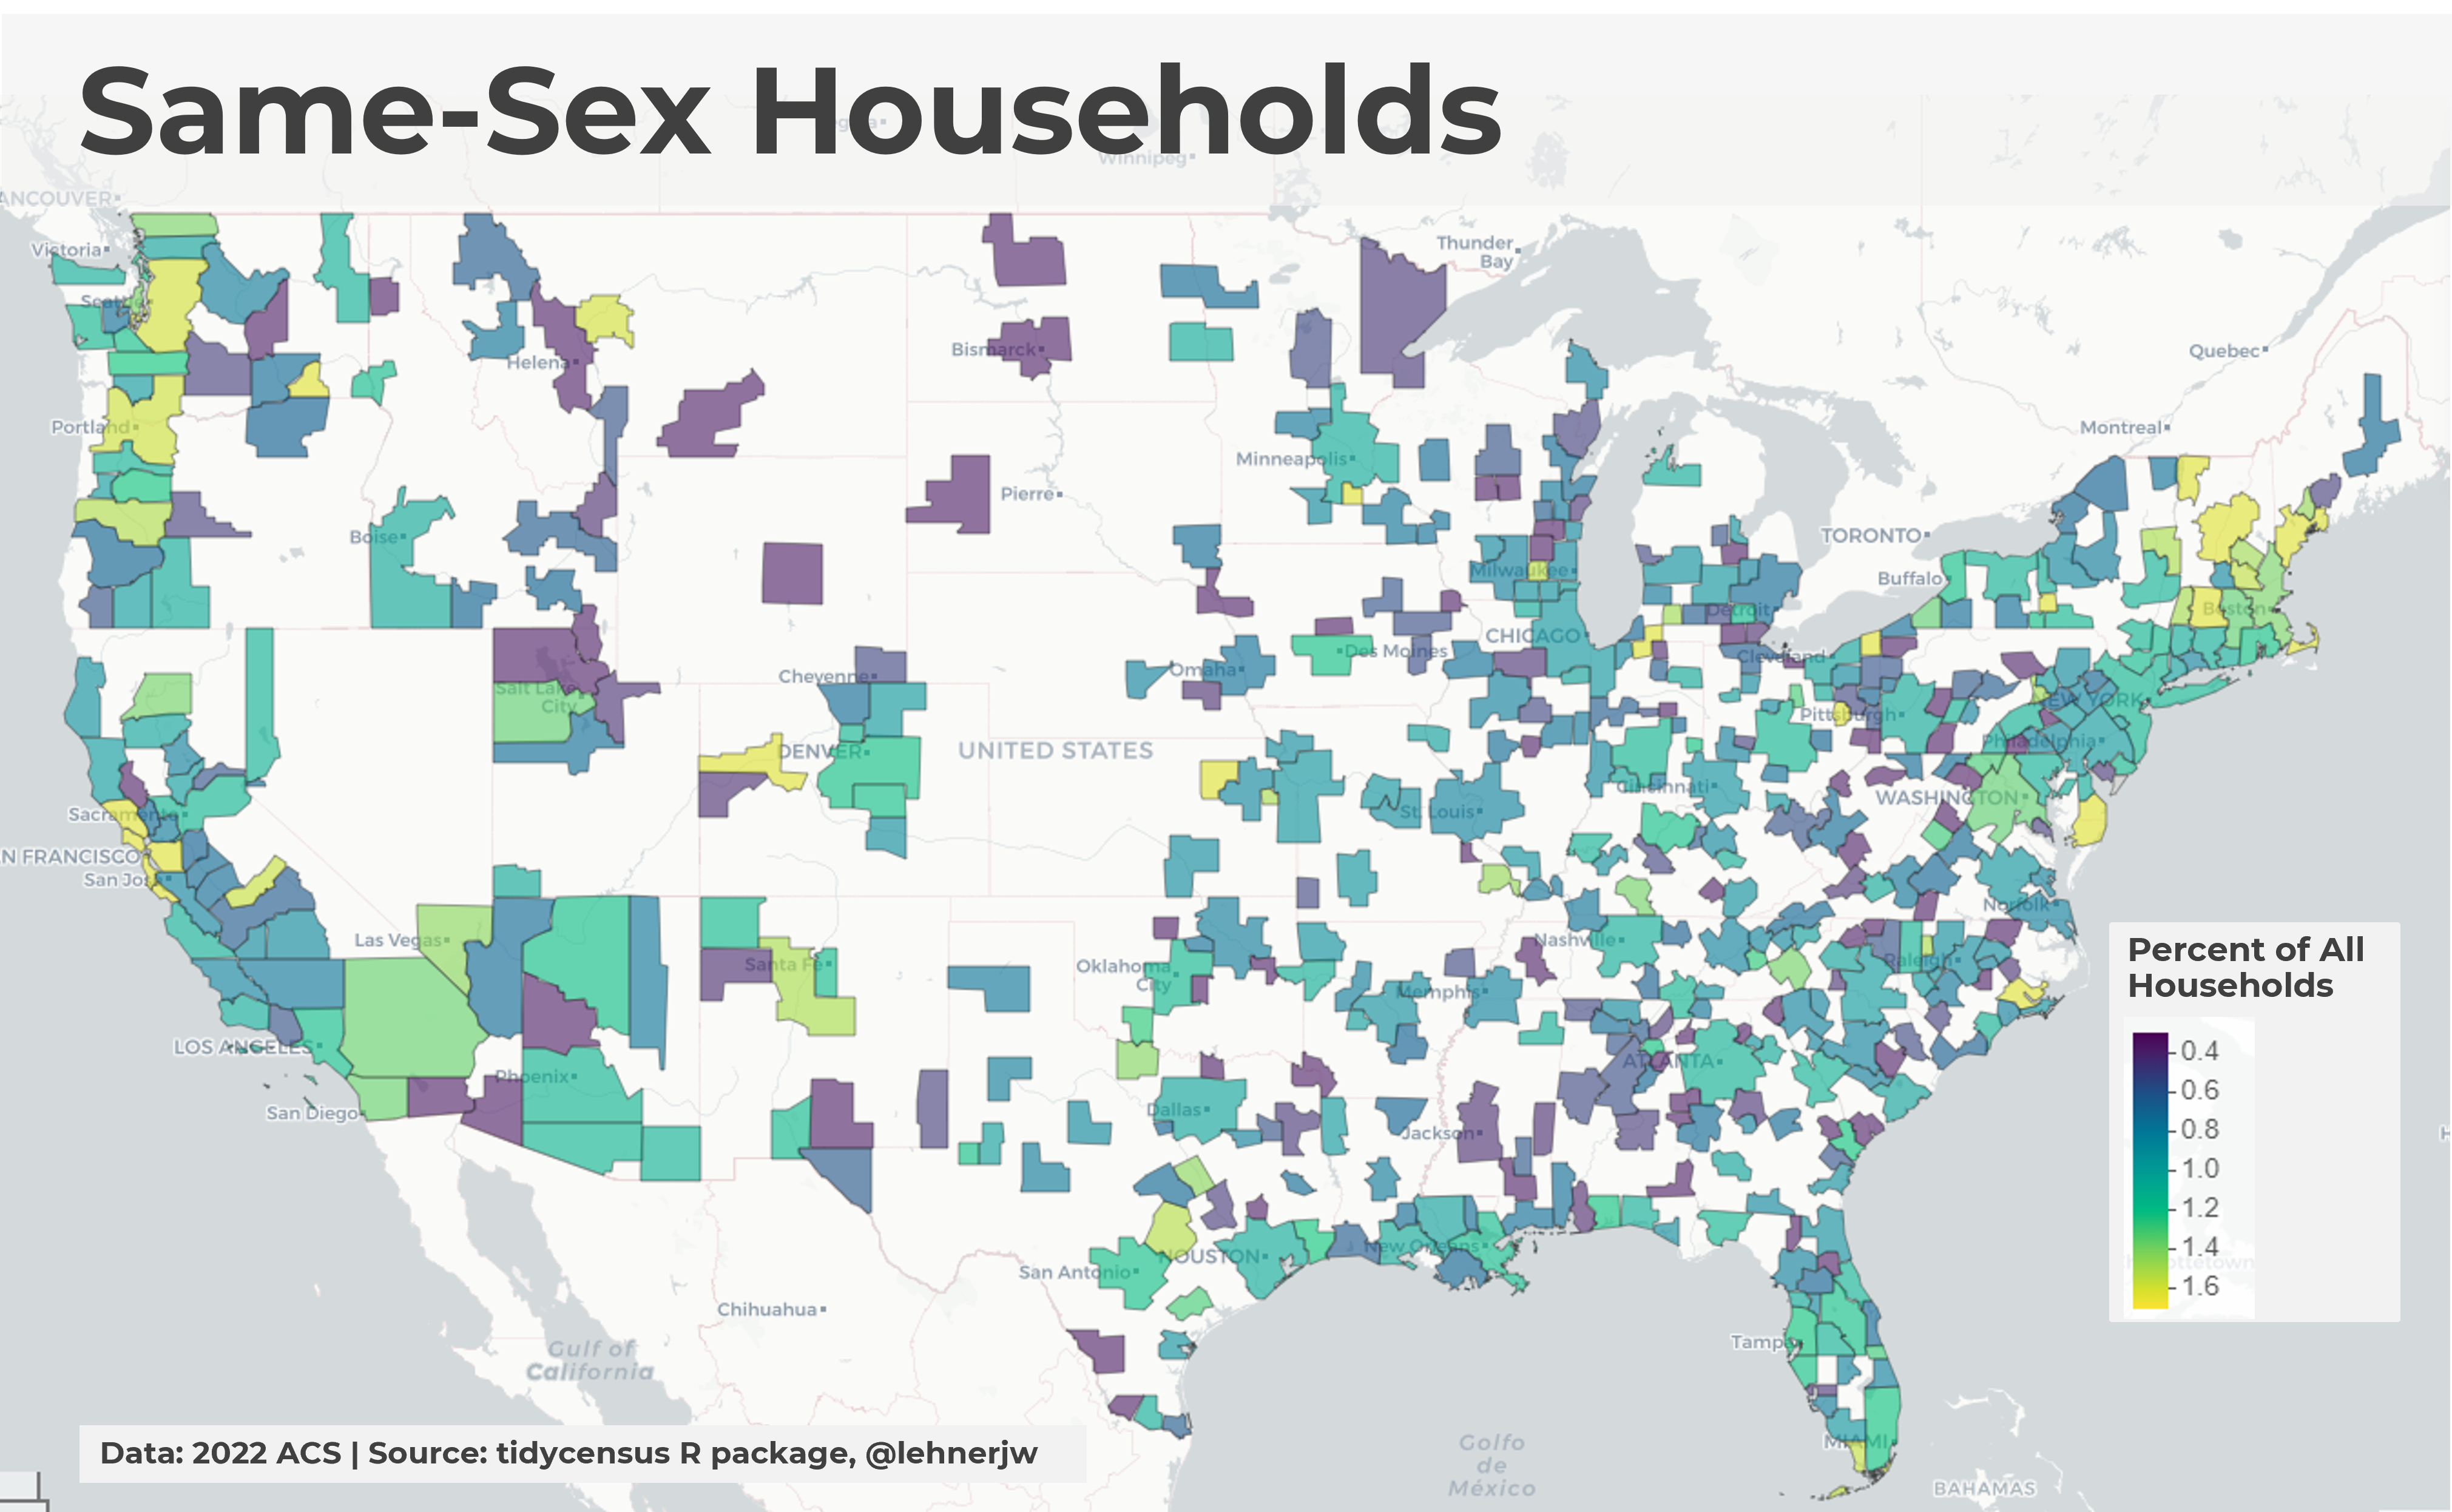
The map below shows the share of all local households that are same-sex couples across all of the metropolitan and micropolitan areas in the country. Yellow regions are the highest shares, green are above average, blue are below average, and purple are significantly below average. In general, nearly all of Oregon is average or higher. Although lower rates are seen in the Bend (Deschutes County), Grants Pass (Josephine County), and Roseburg (Douglas County).
Note that to better show the variability in the data I did do some top coding for mapping purposes, where the maximum value is 1.7 percent, matching the SF share.
When it comes to homeownership I want to focus the data just on married couples. The reason is unmarried cohabitating couples tend to be younger, and therefore lower income given their stage in life and lower rates of homeownership. Now, among married Oregon couples, 42% of opposite-sex couples live in the Portland Tri-County area while 58% of same-sex couples do. Specifically, Multnomah County is home to 15% of all opposite-sex married couples statewide, and 37% of the state’s same-sex married couples.
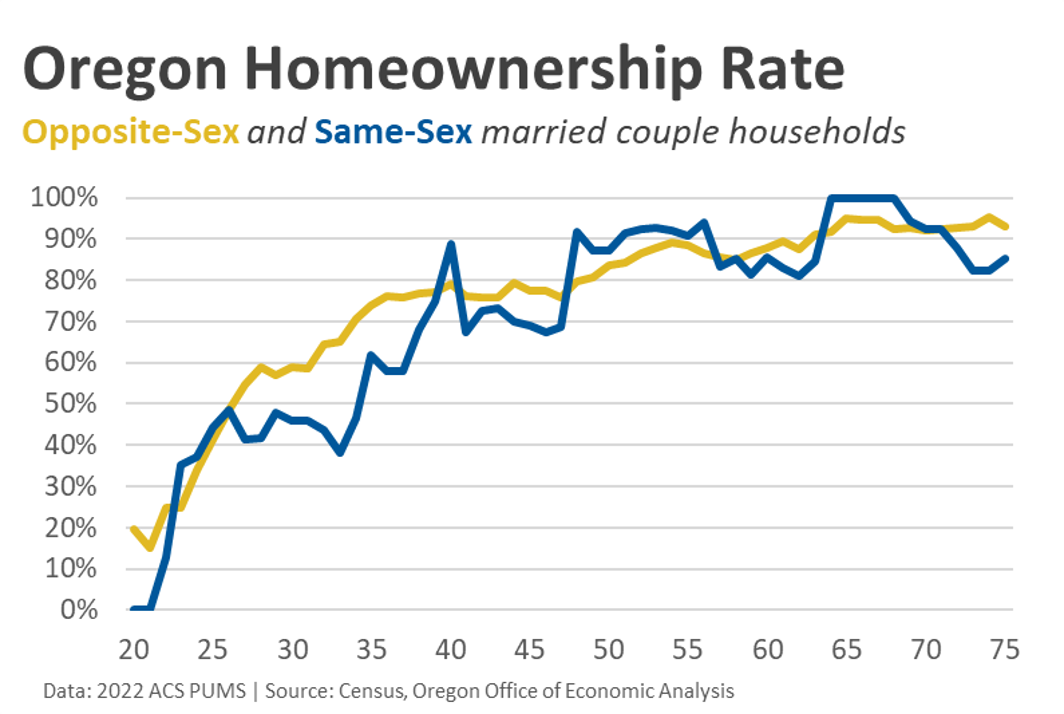
Homeownership among same-sex married couples broadly follows the same patterns by age as for opposite-sex married couples. That said, ownership rates are somewhat lower among those younger than 40, and then similar if not a bit higher for middle-age and older adults. Keep in mind that due to sample size, the local data can be noisy even if the broad trends are clear. In looking at the U.S. data (not shown here) the same exact patterns are seen where there are lower homeownership rates among younger same-sex married couples, but similar or higher rates among older married couples.
At first, I thought given the geographic patterns that part of the lower homeownership rates among younger same-sex married couples could be due to higher housing costs in the Portland region. Not that housing affordability (cost as a share of income) isn’t bad across the state because it is, but from a sticker price view, Portland is generally higher cost of living. As such there was a possibility that the ownership rate differences could be a sort of Simpson’s Paradox. But that is not the case. Younger same-sex married couples have relatively lower rates in Multnomah, in the Portland suburbs, in the state’s other metro areas, and in rural Oregon, while middle-age and older couples have somewhat higher rates. At least in the most recent data this pattern across ages is statewide.
Finally, when it comes to diversity and different socio-economic groups or subpopulations, getting accurate data is challenging. Both from a historical exclusion perspective and a sample size perspective. So it is good to see Census add detail to their available data, and to see that the relative patterns across various data sources are broadly in agreement.

Leave a comment