While population growth slowed earlier in the pandemic, we know that overall household formation certainly did not. As discussed the other day, from 2019 to 2021 the increase in the number of Oregon households outpaced net new construction by nearly 25,000. This deficit was evident in all parts of the state, resulting in tight ownership and rental markets. Unfortunately, Oregon was not alone. During the pandemic the housing shortage went national with household formation outpacing new construction in every single state.
Looking forward, household formation will slow. Some of the recent, strong increases likely represent a pull forward of demand from future years. A key measure is the so-called headship rate. Headship rates are the share of individuals who are a householder (formerly called head of household). It represents how many households there are relative to the size of the population.
In terms of the pull forward in demand, this is particularly the case for homeownership given the large increase in both headship and ownership rates among Millennials. Given affordability has fallen off a cliff with the sharp increase in mortgage rates, which are expected to remain high for the foreseeable future, it will likely be a couple of years before ownership demand fully returns. In a sense, Millennials were a key driver of the pandemic housing market and certainly those that suffered the most from it.
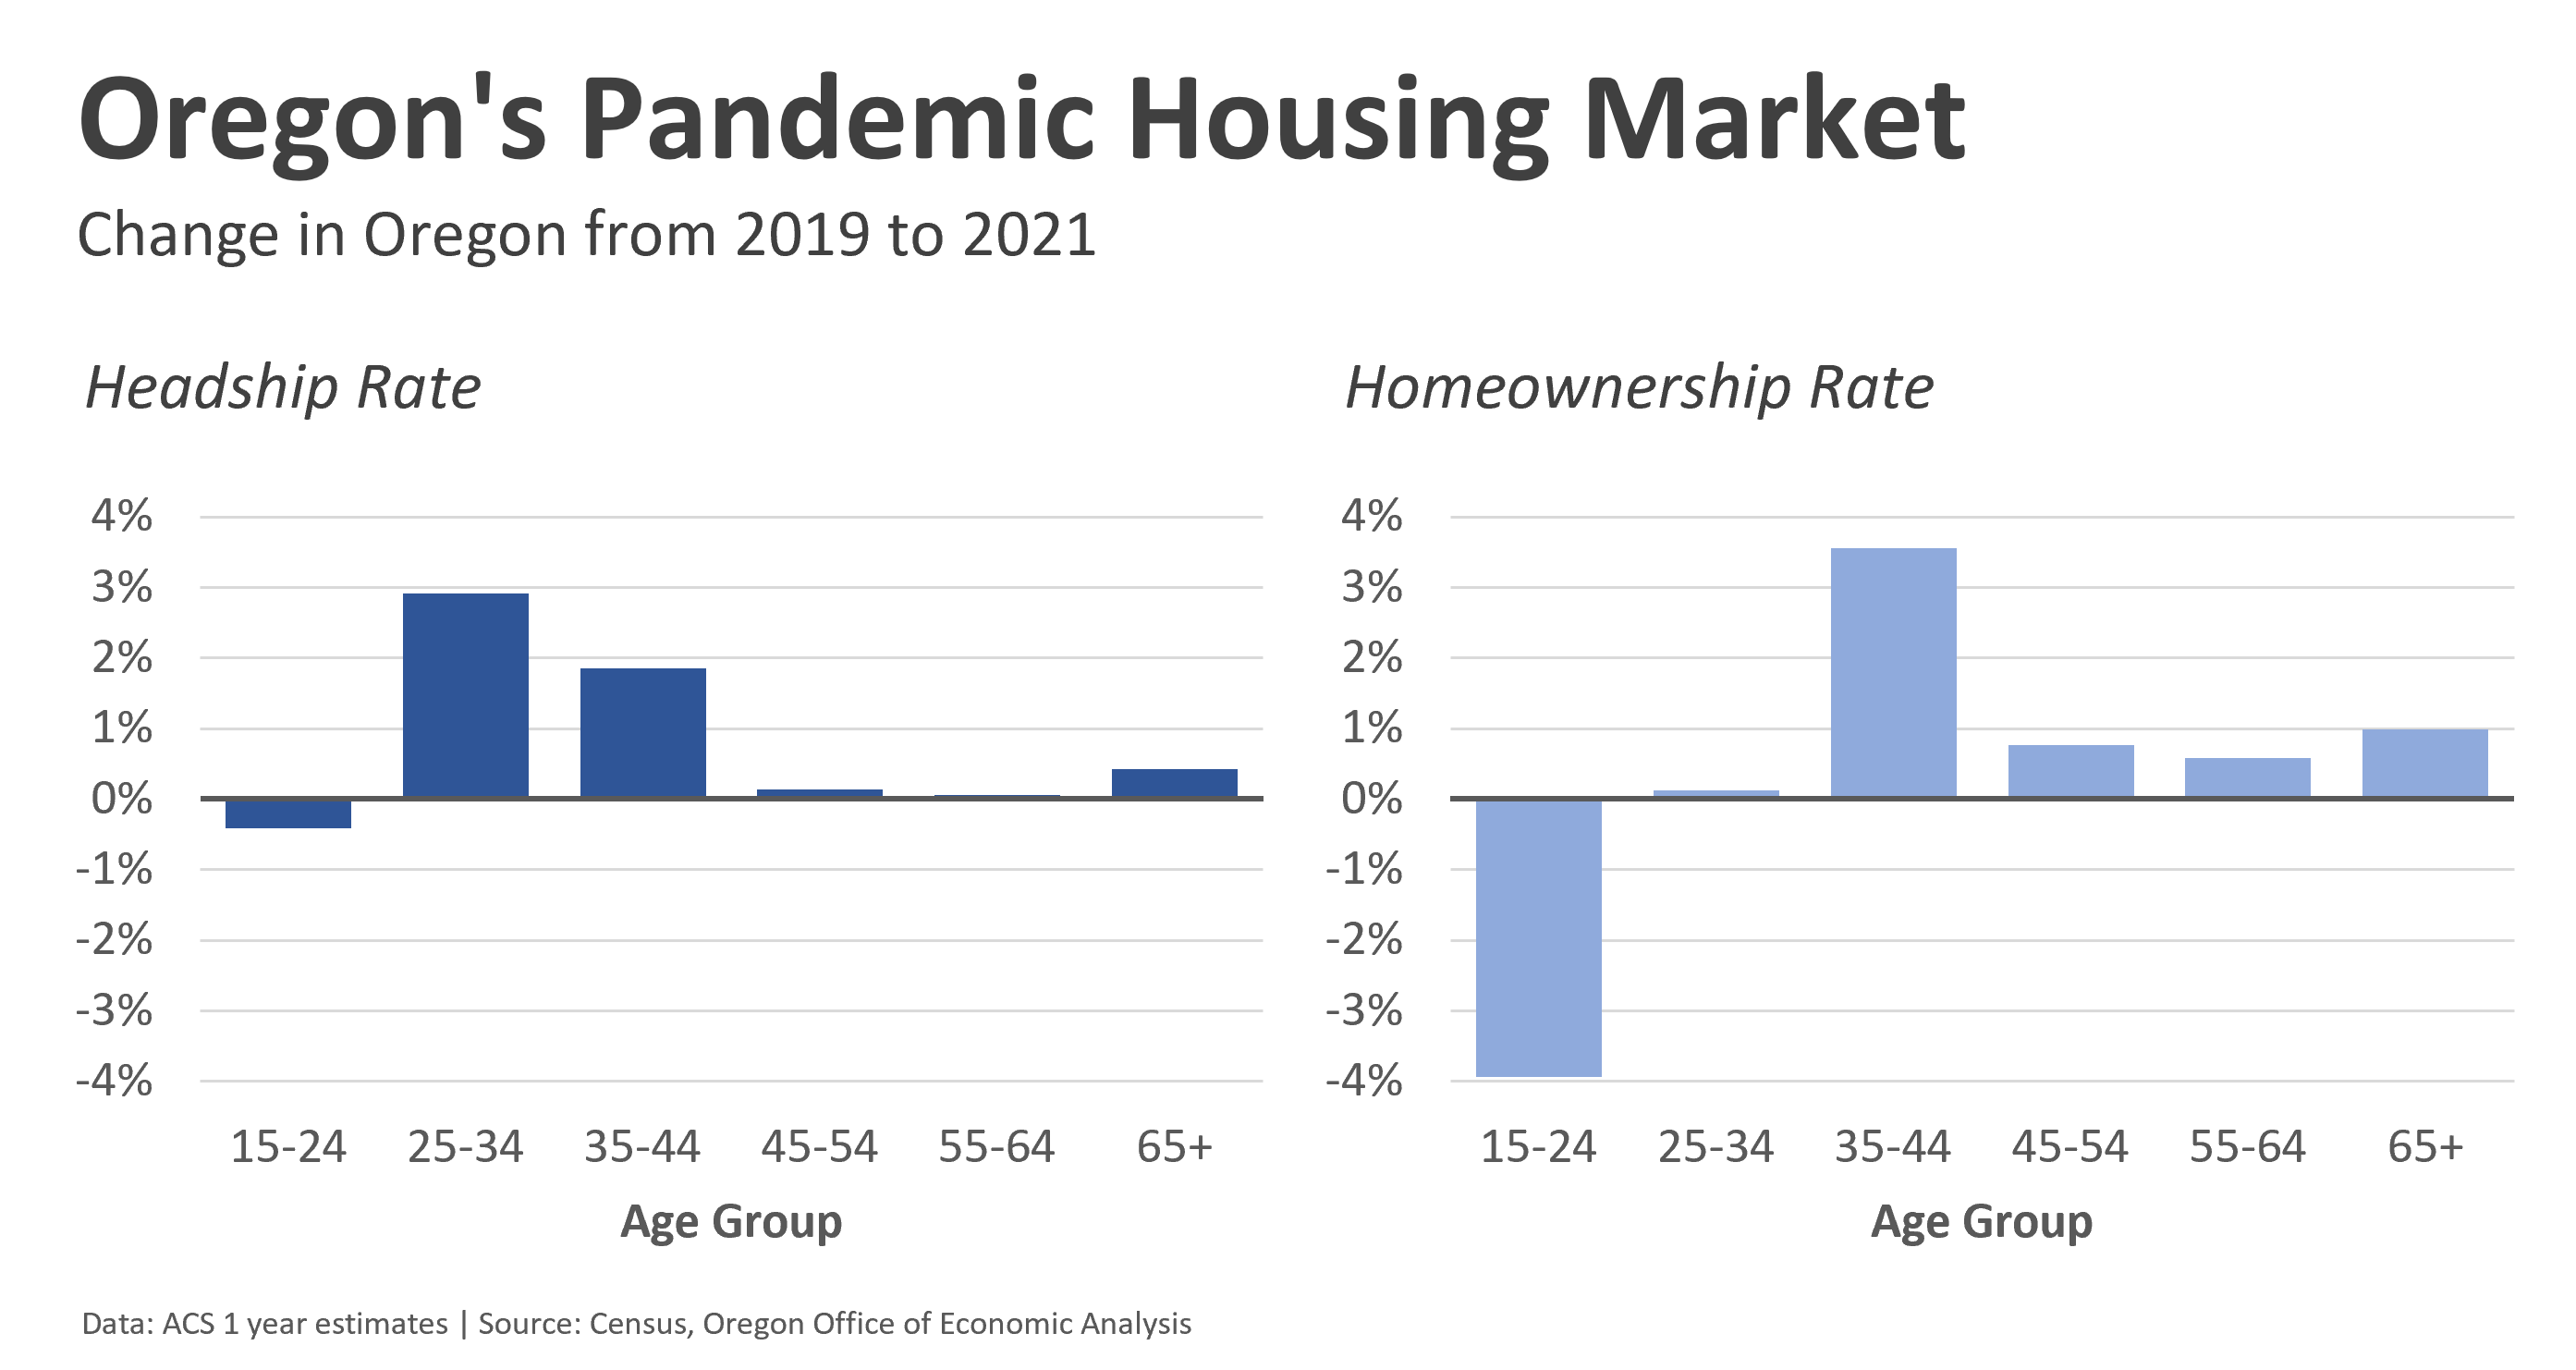
When looking at the data, the big picture story is homeownership increased a bit across most middle- and older-aged households. The overall homeownership rate in Oregon now stands at 63.8%, its highest rate since the mid-2000s when it was in the 64-65% range. By far the biggest increase in ownership during the pandemic was seen among the older Millennials. Younger Millennials, who are more likely to lack the incomes and wealth needed to buy homes, did not see an increase in ownership. However the younger Millennials did see the largest increase in headship rates. What the data implies is that there was a big increase in household formation among 20-somethings that filled all the newly vacated rentals as more households shifted into ownership.
Rental demand has more cross currents moving forward. The near-term risks are weighted to the downside. On one hand, some of the pandemic strength is due not to more households being formed per se but likely due to fewer households dissolving. The expiration of rental assistance and eviction moratoriums means some households will be lost. Keep in mind that many of these households would have dissolved, or fallen through the cracks previously if not for the increase in aid and moratoriums. Now that those are gone, a return toward pre-pandemic patterns is expected. Furthermore, when a contagious virus is going around, people desire to have fewer roommates for health reasons. As the pandemic wanes, living with roommates will again be more common. This should be most evident among young renters in the city, as compared to fewer changes in household size in the suburbs.
On the other hand, the combination of income growth, rebounding migration, underlying demographics, and sharp decline in ownership affordability all point toward solid rental demand. Note that rental and ownership household formation tend to move together over time, but given the large, sudden change in ownership affordability, there may be a temporary mismatch today where rentals hold up longer.
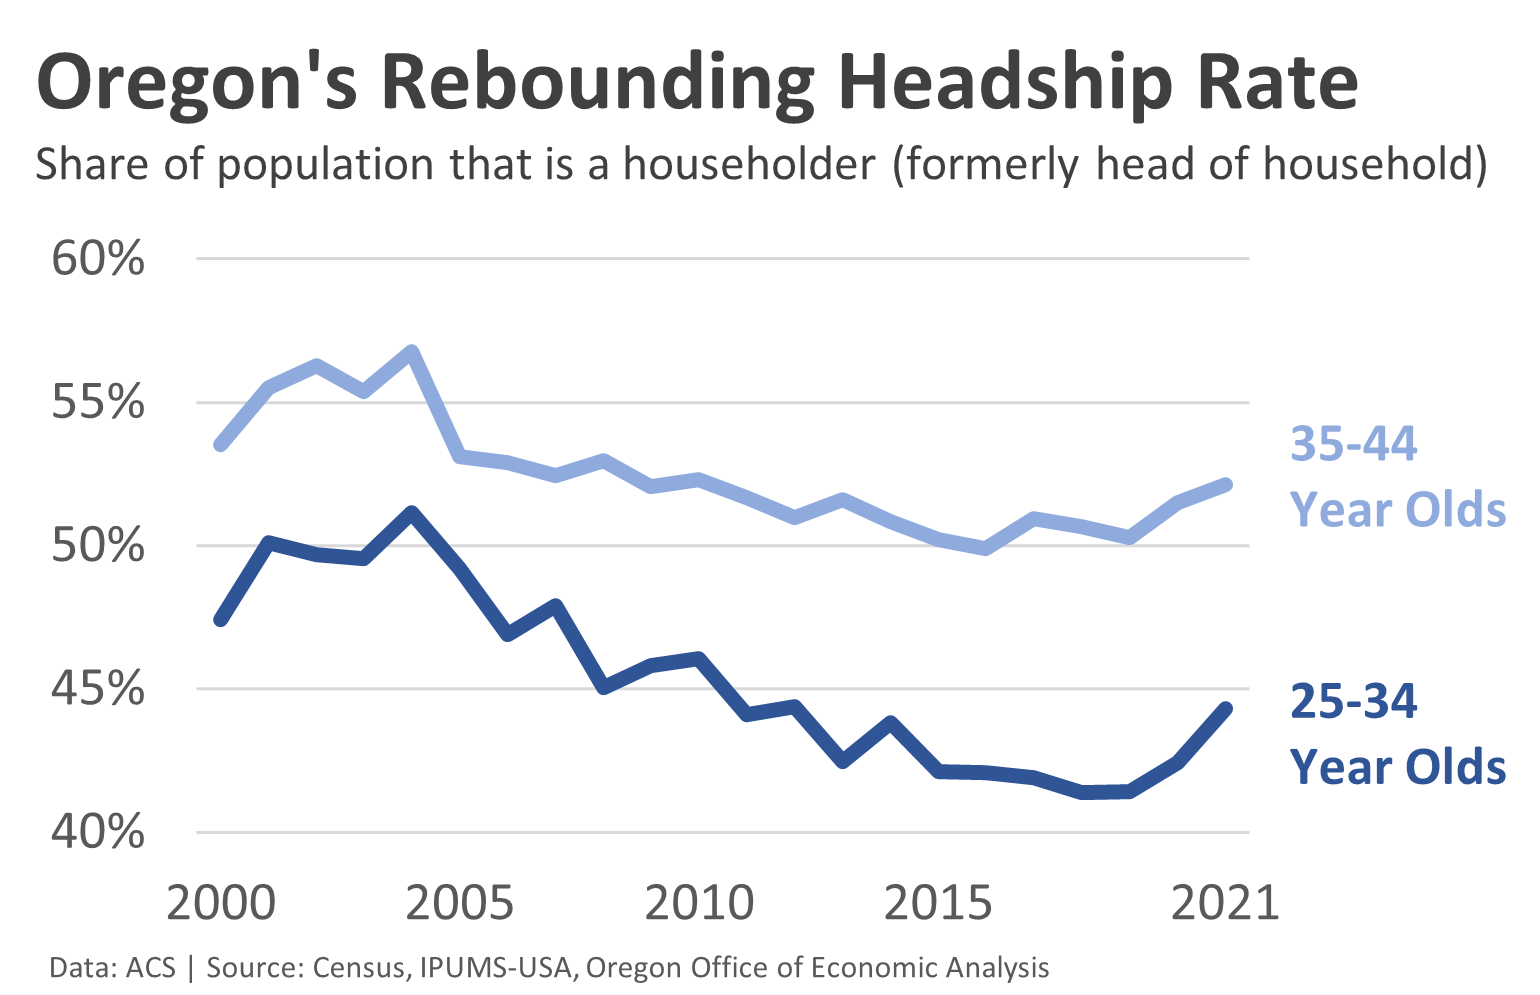
One wildcard here are rents themselves. Affordability problems are a big reason why household formation slowed in recent decades. To the extent that today’s high rents once again impact people’s ability to live on their own or require them to share the costs across more roommates, then the recent household formation boom may be short-lived. However, there are two reasons why most the headship rate increases are likely to stick. First, the increases only bring headship rates back to where they were in 2010. These are not rates wildly out of line with recent history. Second, there are currently a lot of housing units under construction but not yet finished. So if demand (household formation) is slowing, and supply is catching up, this should bring better balance to the market and slower price increases, which in turn help hold up the headship rates.
These trends are seen statewide as shown above, but are a bit more pronounced in the City of Portland, the state’s primary urban center. Formation rates among 20- and 30-somethings in Portland proper really increased in recent years. This large of a jump is due to both the numerator and denominator moving in the headship rate calculation. The number of households did increase, but the population growth was slower or stagnant, pushing the headship rates mathematically even higher than you’d think otherwise. If there are going to be household formation declines in the years ahead this is where I would look first. Now, to the extent this shift is due to many of the new apartments being studios, then it could be a fundamental change. To the extent this shift is more about having fewer roommates during a pandemic, it would be reasonable to expect declines as people take on roommates at something closer to pre-pandemic rates.
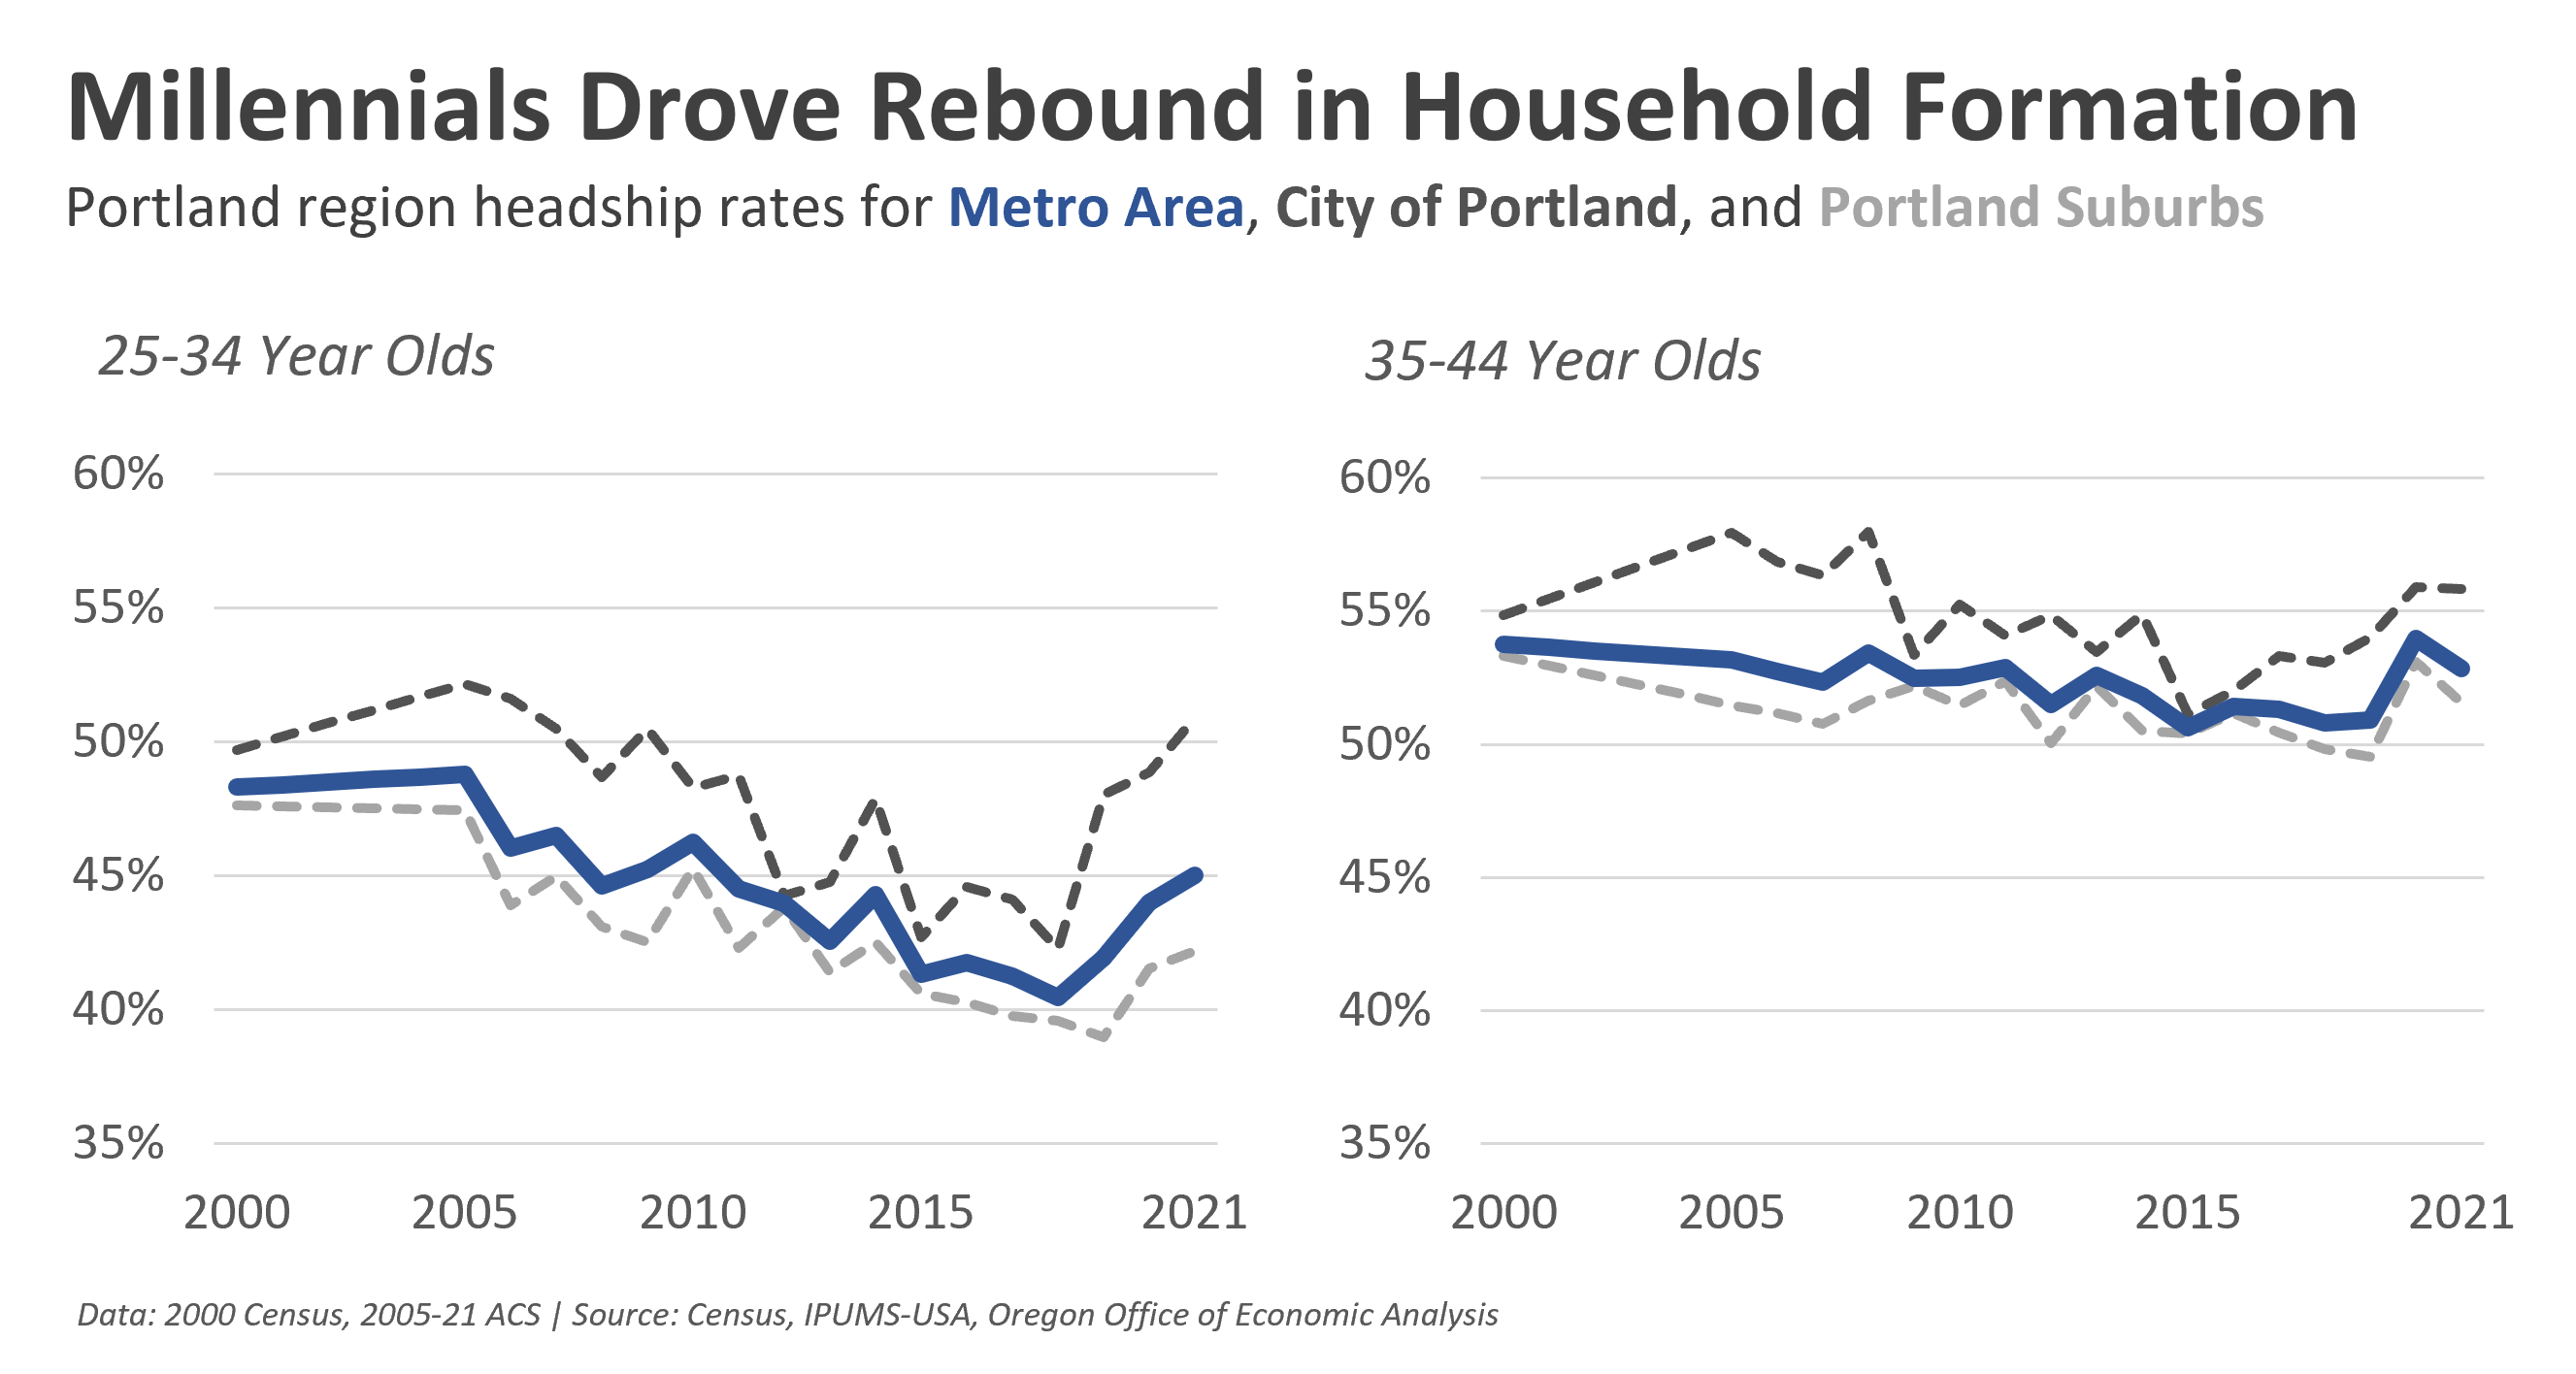
Note: As you can see in the chart, headship rates are higher in the city than in the suburbs. This confirms the stereotype that those living in city tend to be single and/or childless to a greater degree than the suburbs, where families are more prevalent. Of course stereotypes are not monolithic. But the data do confirm these trends and show smaller household sizes in the city and larger household sizes in the suburbs.
One final thought. The 2020s economy should not be a repeat of the tepid 2010s. The labor market will be tighter and income growth likely faster, particularly for younger workers and households. Household formation should likewise be stronger. This is especially the case if new construction is boosted to address the state’s historical underproduction, providing both more units for Oregonians to actually live in, and better relative affordability so that we can afford to do so.
To really get at household size by age and type of unit, plus any further breakdowns by race and ethnicity, incomes, more specific geographic locations and the like, we really need to wait for the microdata to be released in the weeks and months ahead.

Leave a comment