Strong household finances have been the economic story of the pandemic. I know we have talked about it a lot but there are a couple of new pieces of data worth highlighting to help update the overall picture. Last Friday the Bureau of Economic Analysis released U.S. data on income and spending for August, and state level income data for 2022q2. Included along with each were revisions. Let’s take a quick look at two things that stand out with the revisions.
First for the U.S. incomes were revised down slightly and spending up moderately. The net result of lower incomes and higher spending is less savings. The implication here is that the estimates of “excess savings” for households is both smaller and being drawn down faster than previously thought. Now, savings is still increasing overall, when we say excess savings we are talking about above-trend savings that happened early in the pandemic. The total amount of savings today is still higher than it was pre-pandemic. However the impact of inflation forcing households to spend more so far this year is larger than the previous data had indicated. The current data shows that the U.S. personal savings rate today is 3.5 percent which is less than half the pre-pandemic savings rate. Even so, our office’s calculation of excess savings still stands at $1.4 trillion. The current version of the data shows that the stock of excess savings has been drawn down by about a third, whereas the previous version indicated it was more like a tenth. That’s a meaningful difference.

Note: Estimates of excess savings are sensitive to the baseline trend used. Even so, most estimates I have seen are in the $1.2-$1.7 trillion range. For the record I am using the Jan 2019 – Feb 2020 average savings rate as the baseline and calculating deviations relative to that over the past two and a half years.
Regarding savings in Oregon here is what our office wrote in our most recent forecast:
While timely Oregon data is lacking, our office’s contacts among local financial institutions confirm similar patterns are seen locally as well. Deposits at local banks and credit unions surged earlier in the pandemic, however deposit growth has slowed noticeably so far in 2022. Oregonians have money, and higher bank account balances today, but those balances are not growing quite as quickly as we are paying higher prices for the same goods and services.
Second, Oregon’s incomes in the second quarter came in slightly above forecast (0.7 percent). However this is a mixture of two things going on. On one hand historical revisions to Oregon income were up by about 1 percent overall. On the other hand that means after accounting for the revisions, incomes came in slightly lower than expected, due to a slowdown in aggregate wages. That’s a lot to unpack and our office will discuss it further in our next forecast, due in 6 weeks (Nov 16th).
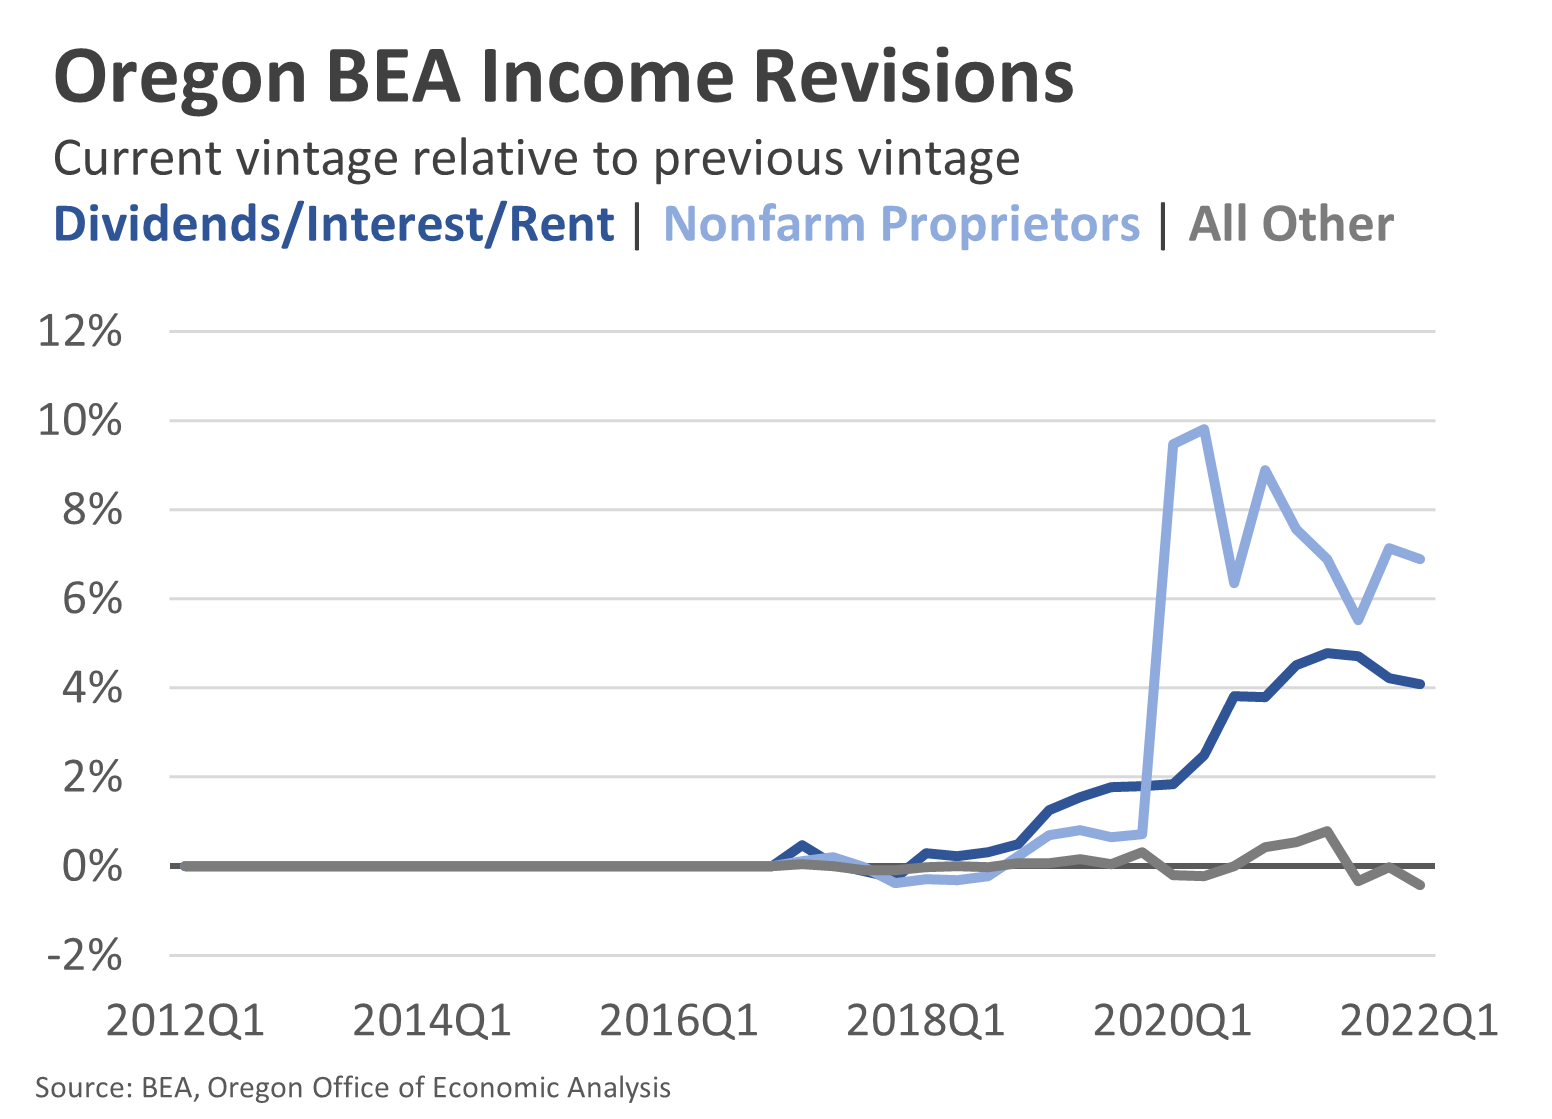
On the revision side the real story is the large, upward revision to Oregon non-wage incomes. Nonfarm proprietors’ income is revised up by about 7 percent. Dividends, interest, and rent is revised up by about 4 percent. All other types of incomes were relatively unchanged by this round of revisions. Given the tax season we just experienced, these upward revisions to non-wage income are no real surprise. In fact given just how strong tax returns have been, further upward revisions in the future are likely.
This post is mostly just an update on the state of where things stand, or at least where they stand based on the latest data. If there is some sort a big picture takeaway from this its something like the following. When households have the ability and are showing the willingness to pay higher prices, it can reinforce and sustain faster inflation. Yes, a big part of the inflation story today is the reopening of the economy, the overloaded supply chains, and the oil shock from Russia’s invasion of Ukraine. However that’s not everything. The risk here is that if the higher underlying trend in inflation gets embedded in the economy than the economic pain needed to bring it back down to the Fed’s 2 percent target will be bigger.
From a macroeconomic perspective we do need to see slower income and spending gains to slow that underlying trend in inflation. We also need more business investment and productivity gains. But if savings is being drawn more than previously thought, and wages are coming in a little below forecast, combined with asset markets being down this year, these are all things that normally look worrisome but in the context of today’s economy are needed and welcomed. As we wrote in our document the data is possibly beginning to fall into place, but getting everything just right is hard when the actual impacts of Fed policy are not known for quite some time.
Lastly, a big concern here is the distributional impacts of inflation, incomes, and spending. We know that low- and moderate-income households suffer the most from high inflation. They live paycheck to paycheck and so high inflation impacts every single dollar they earn. One counterbalancing factor here is that wage growth remains strongest among lower-paying industries and occupations. And a tight labor market is driving employment rates higher for all Oregonians regardless of geographic location, race or ethnicity, or educational attainment. It’s national data, but we did just get two new encouraging updates on this front through the second quarter. The Federal Reserve’s distributional accounts show that net worth is rising and even liquid assets like bank account balances, which are part of “other assets” in the data, are holding steady for households in the lower two quartiles. Similarly, new data from the JPMorgan Chase Institute show that account balances remain up across the distribution.

Leave a comment