Our office has done a lot of housing work in recent years — things like The Housing Trilemma, Peak Renter, Rural Affordability and The Housing Inflection Point — but haven’t published much of the basic nuts and bolts numbers. What follows is a handful of updated charts that show the still incomplete housing recovery.
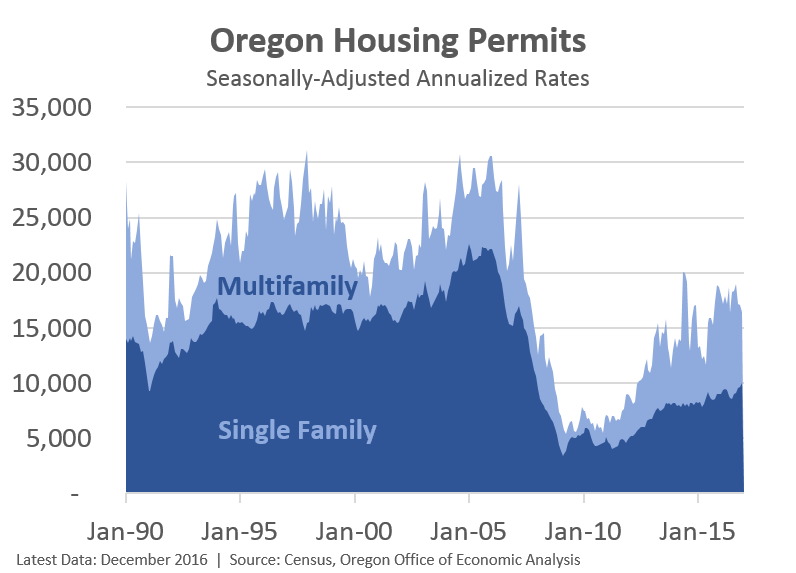
First, permits for new construction continue to increase, albeit slowly. Multifamily permits rebounded first and seem to be holding steady at a relatively high level — somewhat larger than the mid-2000s but not quite as strong as the construction booms in the late 1980s and late 1990s. Single family permits have lagged and are just now about halfway back to 1990s level of construction, let alone peak bubble rates.
Given the nature of the Great Recession — a housing bubble and financial crisis — it wasn’t a huge surprise to see housing lag the recovery, even if it used to be the first thing to bounce back. However in recent years the lack of construction has become a big issue in terms of eroding affordability, which is a national and a statewide problem.
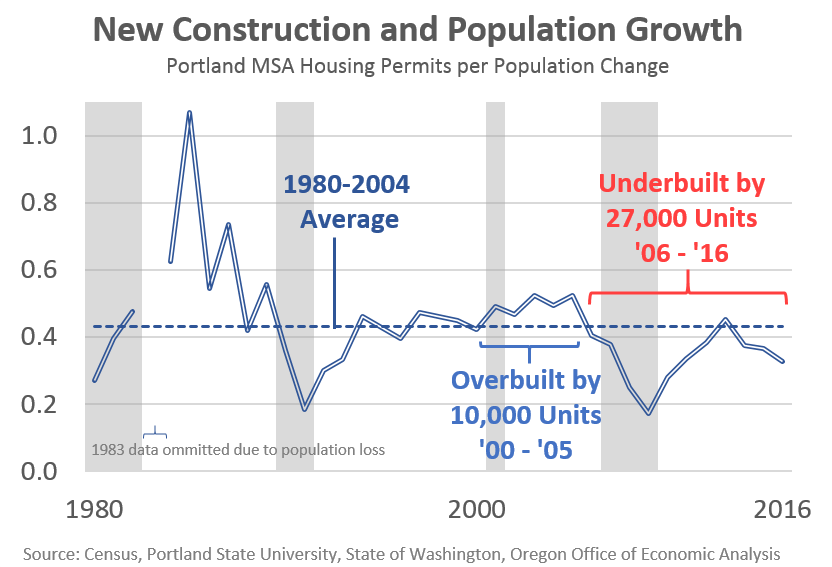
Of course it’s not just that the total number of housing starts is relatively low that’s an issue. The problem is that the level of new construction in the past decade has been considerably less than what is needed to keep pace with a growing population. It’s the lack of supply relative to the growing demand that underlies the affordability challenges. The housing bust has clearly been disproportionate to the boom. The fact we were/are underbuilding was apparent all the way back in 2011. While our office had a more subdued housing outlook than many national forecasters, we still expected starts to increase faster than they have to meet the the actual need and demand in the economy.
Note: While our office’s chart below tracks the Portland region, everywhere else in the state I have looked, the pattern is essentially the same.
In terms of the outlook, our office still expects housing starts to increase a bit further. As we write in our forecast document:
Over the extended horizon, starts are expected to average a little more than 23,000 per year to meet demand for a larger population and also, partially, to catch-up for the underbuilding that has occurred in recent years. As of today, new home construction in cumulatively about one year behind the stable growth levels of prior decades even after accounting for the overbuilding during the boom.

Just as construction activity has yet to recover, construction and related employment remains about 15 percent below pre-Great Recession levels [1].
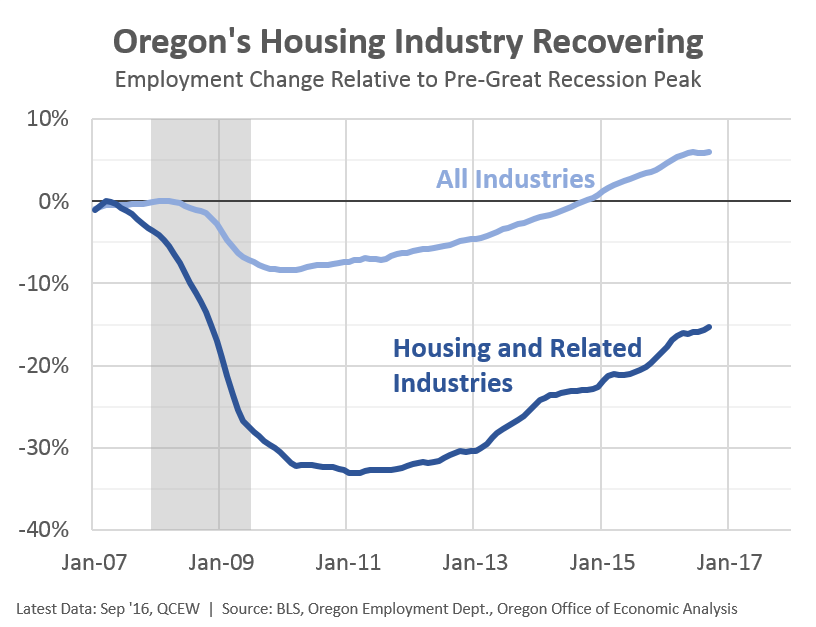
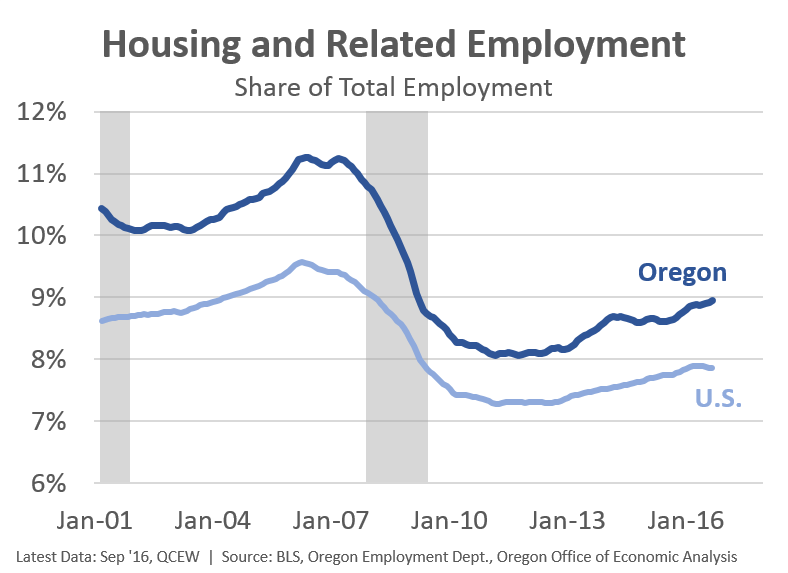
Such jobs have been growing at an above average pace in recent years, however there remains considerable room left to go in order to return to something approaching historical norms. It should also be noted that housing (and government) jobs represent a larger share of local employment in the state’s secondary metros and rural areas. As the housing market has returned to growth, it has boosted local economies in recent years. This was missing throughout the early stages of recovery in much of the state.
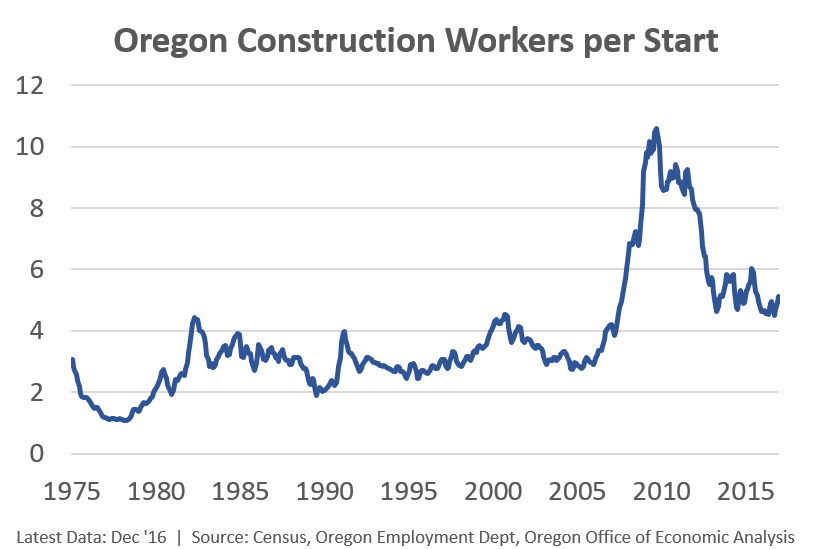
One other interesting trend has been the shift in the number of construction workers per housing start. This ratio remains higher than has historically been the case. Now, I don’t think it means there are literally more individuals working on each home. Rather it is a crude ratio. The shift likely reflects a few different trends, including more multifamily, but also increased remodeling activity which requires workers (and permits) but does not result in a newly build home.
Overall these trends seen in the data are not unique to Oregon. The national data show the same issues. That is both encouraging and discouraging at the same time. On the positive side, it means that local problems are not the main driver behind the housing market issues today. On the bad side, it means there is something impacting the entire national housing market that is driving these results which makes it harder to fix locally. Our office has dug into a number of the supply side constraints in recent months and will summarize that work in the near future. Update: Here is our summary of the main supply constraints.
[1] A big thanks to Lauren Cummings and our friends at the Employment Department for helping with the data used here for Construction and Related Employment. Based on BLS research, the following industries are included: Construction, Wood Products Mfg, Cement and Concrete Product Mfg, Architectural and Structural Metals Mfg, Construction Machinery Mfg, Lumber and Construction Supply Wholesalers, Hardware and Plumbing Wholesalers, Furniture Stores, Building Material and Garden Supply Stores, Real Estate Credit, Mortgage Loan Brokers, Office of Real Estate Agents, and Activities Related to Real Estate. See here for more.

Thank you. This is a very impressive discussion of a complicated set of problems. Really good job making it understandable to folks who don’t get things like the “marginal propensity to consume”. Nice work. I’d like to see more on the accumulated shortages, especially in the metro areas.
Jerry M. Walker
HCMA-Portland
Portland, OR
503-493-0813
503-705-4624
From: Oregon Office of Economic Analysis
Reply-To: Oregon Office of Economic Analysis
Date: Tuesday, March 28, 2017 at 1:33 PM
To: Jerry Walker
Subject: [New post] Housing Recovery Still Incomplete
Josh Lehner posted: “Our office has done a lot of housing work in recent years — things like The Housing Trilemma, Peak Renter, Rural Affordability and The Housing Inflection Point — but haven’t published much of the basic nuts and bolts numbers. What follows is a handful o”
By: Jerry Walker on March 28, 2017
at 2:18 PM
I note that the number of workers per housing start showed a very rapid initial rise as the bust took hold, perhaps because it took some time for the industry to adjust and shed excess workers. But curious that the ratio has stayed relatively high. This is just speculation, but I wonder if that increase may also reflect, to some degree, a generational shift in the workforce. A lot of the “old hands” may have thrown in the towel and retired or moved on to other work as a result of the bust, and we now have a new cohort of younger and cheaper workers, who are more affordable but are also perhaps somewhat less productive, at least for now. Or, could a rise in less-than-full-time employment be playing a role in these figures?
By: Bill Clingman on March 28, 2017
at 3:40 PM
[…] Transportation jobs saw slower growth. Construction did too which is interesting given the ongoing (slow) housing recovery. Production jobs — essentially the manufacturing jobs that do the manufacturing — saw […]
By: Job Polarization, 2016 Update | Oregon Office of Economic Analysis on March 31, 2017
at 8:32 AM
[…] Across the state, the construction industry isn’t building housing in the numbers seen during previous booms, according to numbers crunched by the Oregon Office of Economic Analysis. […]
By: Not Enough Housing Being Built in Oregon Post-Recession, Say State Economists | eClips on April 3, 2017
at 10:08 AM
[…] The Oregon Office of Economic Analysis argued that the housing recovery is still incomplete. […]
By: Weekly Roundup: Japanese Garden, PDX Commons, Viking Pavilion, and more - Next Portland on April 3, 2017
at 12:55 PM
[…] recovery in Oregon is still not complete when compared to the 1980s and 90s, which economist Josh Lehner says is due to a lag in construction of new homes and units. But, he says housing affordability is […]
By: Housing Recovery | Self Driving Car Cities | eClips on April 7, 2017
at 8:02 AM
[…] noted that home construction over the past 10 years has failed to keep up with population growth. In a blog post at OregonEconomicAnalysis.com, Lehner wrote that Portland under built by 27,000 units between 2006 and 2016. “It’s the lack […]
By: Should the Urban Growth Boundary be expanded in Under Built Portland? | ABRWinkler on April 11, 2017
at 3:33 PM
[…] housing recovery is still incomplete. Even in the nation’s fast-growing metro areas, new construction is not keeping pace with […]
By: Causes of the Great Housing Shortage | Oregon Office of Economic Analysis on April 12, 2017
at 9:16 AM
[…] housing recovery is still incomplete. Even in the nation’s fast-growing metro areas, new construction is not keeping pace with demand. […]
By: Causes of the Great Housing Shortage | eClips on April 12, 2017
at 9:19 AM
[…] is some forthcoming research by ECONorthwest, led by Mike Wilkerson. While our office has done some back-of-the-envelope calculations trying to quantify the underbuilding of housing, Mike and ECONorthwest bring a full-fledged model […]
By: Why Housing Supply Matters | Oregon Office of Economic Analysis on December 14, 2017
at 9:47 AM