When energy prices rise, it usually eats away at consumers’ discretionary spending which has economic impacts, even if total, overall spending remains intact. One item UCSD Professor Hamilton, over at Econbrowser, tracks regularly is the share of energy expenditures as a share of consumer spending. He uses the rule of thumb of 6% as a warning signal – that is, when consumers spend more than 6% of their budgets on energy, it has economic consequences. For those interested, Professor Hamilton also frequently posts on many different aspects of energy markets, including prices, production, transportation and the various factors that affect these items.
The purpose here isn’t to discuss the impact on consumers’ budgets but rather to examine the current state of energy prices and their relative outlook. The standard graph our office normally uses looks like the following. Until the middle of the last decade oil and natural gas prices more or less followed each other but have since diverged. Note that the forecast figures used here come from the Annual Energy Outlook 2013 produced by the U.S. Energy Information Administration. [Other proprietary forecasts our office has access to do not differ widely from this outlook, particularly for the longer term.]
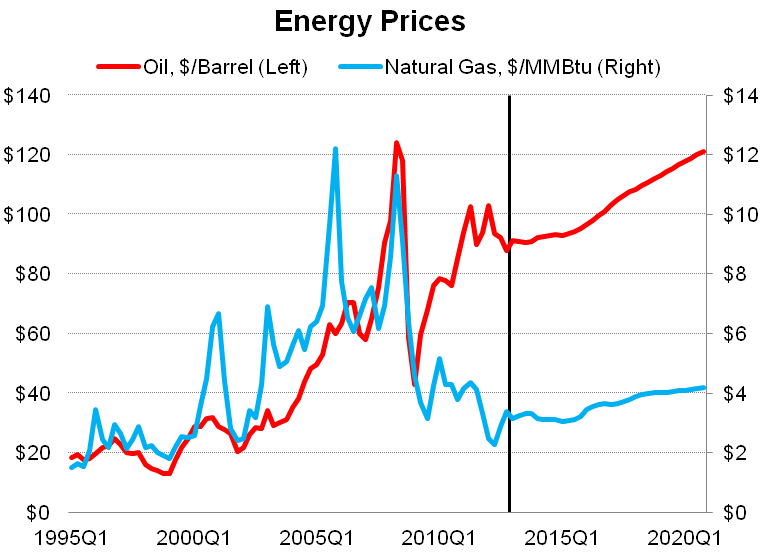
While it is easy to show the lines diverging when on different axis and measured in different units – price per barrel of oil compared to price per million BTU (MMBtu) – one issue raised with our advisory groups is how do they compare on an energy equivalency. Well, based on my readings, it turns out that this does depend somewhat upon the quality of the products being used so the exact calculation may vary, however a commonly cited factor is 5.8. One barrel of oil is equivalent to 5.8 million BTU of energy and conveniently, natural gas prices are commonly quoted in millions of BTUs. Thus, you take the price for a barrel of oil and divide by 5.8 to arrive at a relative comparison based on energy equivalency between oil and gas. What this means is that today’s barrel of oil, which goes for about $96 (WTI prices) is equal to about $16.55 per million BTU, while the Henry Hub price of natural gas today is about $4. (The data used in these graphs are quarterly and a couple months old, hence the small differences.) That means that natural gas is about 80% less expensive than oil on an energy equivalency basis and the outlook for energy prices projects this difference to be sustained for the foreseeable future.

The issue becomes, what do we do with this price differential and how long can it last? Over time these two products are substitutes so one could reasonably expect there to be some sort of convergence in prices again, however that is a long run solution and takes time. The reason for the drop in natural gas prices is largely due to a supply shock; the increased domestic production has provided larger and larger quantities of gas on the market, putting significant downward pressure on prices. Oil prices on the other hand are being somewhat constrained by the lack of new supply coming online coupled with increased international demand. As Professor Hamilton notes:
Global field production of crude oil … stagnated … between 2005 and 2008. It is up a couple of million barrels since then, but more than 100% of this increase has been consumed by China alone, forcing the U.S. and other countries to reduce our oil consumption.
These forces work to keep oil prices elevated and we have this large gap in prices on an energy equivalency between natural gas, which is effectively being set in a domestic market, and oil, which is being set in a global market.
So what are the benfits of this? From an article on CNBC.com:
Cheap natural gas not only cuts costs for companies that use it as a raw material or feedstock for other products such as chemicals, it also means lower power prices as utilities use more gas to generate electricity.
The article goes on to note that electricity for industrial users on the East Coast is substantially less expensive than some European countries, including about 30% less than in Germany and nearly 60% less than in the U.K. This in turn makes manufacturing less expensive in the U.S. than some international peers and may even lead to the popular topic of discussion: reshoring or insourcing. Or at the least it may slow the tide of offshoring or outsourcing of manufacturing jobs. Cheaper energy prices at home also lowers the cost differential with developing countries, particularly with rising labor costs in places like China. This is all well and good and tells a nice story, however how are we doing on this? Recent research work put together by Goldman Sachs’ economic group sheds some disappointing light on the subject, at least so far. For energy-intensive industries, such as metals and plastics where this cost savings would most likely make a larger impact, their production has actually lagged overall manufacturing production in the U.S. (This figure is taken from Business Insider’s article based on the Goldman Sachs research.)

Additional work done by Cleveland State University (HT: WSJ) shows that even with a shale boom in Ohio, jobs in these regions are not following suit. Furthermore, from a Washington Post article last year, a paper from 2009 finds that “only one tenth of U.S. manufacturing involved energy costs exceeding five percent of the total value of shipments.” To some, all of these findings appear to point to the story that these lower gas prices are not a big deal or will not produce large benefits, however I think a) this isn’t necessarily the takeaway from this research and b) that does not mean manufacturing is doomed. To be fair, as the Business Insider article relays, Goldman Sachs is still bullish on manufacturing overall and writes “[b]ut we believe the reason for this will be broad economic improvement that benefits all sectors, especially the more cyclical ones, not a structural U.S. manufacturing renaissance.”
I think that is a fair assessment. These really low gas prices are certainly beneficial to companies (and homes heated by gas too), improves the relative international cost comparisons, but so far is not a providing a structural renaissance, as some had maybe hoped it would. It certainly has in terms of employment and income for workers in the gas fields (North Dakota unemployment rate: 3.2%) but this has not necessarily translated into a much broader improvement, or at least not yet anyway. Over a much longer time horizon, one would expect there to be some convergence in prices as oil and gas are substitutes. However the costs to switching infrastructure like this are generally large and not done overnight (how often do you replace your home’s furnace?) In the short term, it does appear this price differential is here to stay and natural gas customers do benefit from the increased domestic supply, which does help both business’ bottom lines and household finances.
P.S. I also think the Ohio report is flawed definitionally as many of the workers likely live in the bigger cities, so they show up on employment counts there, not in the more rural areas. Cleveland is classified as a weak shale area while Columbus and Cincinnati are counted as non-shale. The authors do mention this as a possibility, and I would not be surprised to see that it is the answer.

I haven’t done much research on this topic, but there could be an increased risk premium added to global oil prices after 2005 that isn’t shared by local natural gas markets. They wouldn’t substitute. The Iraqi Civil War intensified in early 2006, Hurricane Katrina hit the Gulf Coast in late 2005, etc… Perhaps matching natural gas/oil production, geographic location, estimated supply disruption risk, and futures prices? Its not a structural supply/demand imbalance, but a structural perceived risk of supply/demand imbalance.
By: Mark on April 2, 2013
at 8:17 PM
Outstanding. I agree.
By: http://www.texasbestdefense.com/Cities/Sugar_Land/index.html on April 9, 2013
at 10:01 PM