Just a quick update on employment growth by metro size, similar to previous work (HERE and HERE). This takes a look at county level employment data (QCEW through the end of 2013 was released recently) and categorizes it using the USDA rural-urban continuum codes.
The largest metros (the 51 largest have a population of 1 million or more) have seen the strongest gains in recovery [1]. The second set of metros have seen some acceleration and the nonmetro (rural) counties have seen deceleration over the past year.

In terms of how these growth rates look from a historical perspective, I took today’s rural-urban codes and applied the same categorizations back to 1980 (so a place like Las Vegas which is big today but not then, is still classified as a large metro). What stands out are the largest cities outperformed other locations both in the late 1990s boom and today. However smaller cities and rural areas performed just as well, if not better than, big cities in the 1980s and somewhat during the housing boom.
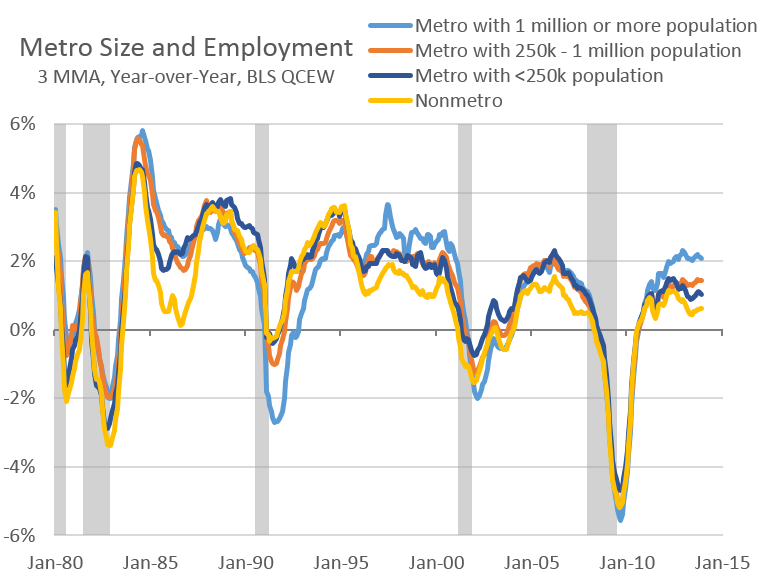
The question is what is the normal pattern of growth? Is is the 1980s and housing boom years where most areas grow about the same? Or is it the mid to late 1990s and so far in the 2010s where larger cities outperform? It’s certainly an open ended question, but most outlooks call for continued urbanization of the population and for metro areas to outperform rural economies in general. This is at least partially due to the fact that all those good economic things — agglomeration effects, knowledge spillovers, clustering, etc — happen in certain locations, which are usually bigger cities. The case could also be made that the housing boom was an equalizer in which small and medium sized metros outperformed due to stronger population growth and the associated housing demand and activity that went along with it. This stronger growth also may have pulled some away from the larger cities at the same time. In this version of the story, today’s pattern of growth is simply a return to the expected one, which was interrupted by the housing boom where inflated asset prices/wealth may have impacted location decisions.
It is also interesting to note that only the largest cities have seen growth rates return to pre-recession levels, while the others lag. This is at least partly due to the nature of the Great Recession in which housing and government have been large weights on the recovery. These jobs also play a disproportionately large role in many medium, smaller and rural economies than in big cities. Not because these areas have so many of these types of jobs, but rather because of lower levels of industrial diversification, that generally occur in bigger cities (ballet dancers, advertising firms and the like).
[1] Breaking these big cities down into more groups reveals the same trends. Large cities with populations of, say, 4 million or more compared with those with populations of 1-4 million have the same employment trends over the Great Recession.

[…] However, the one portion seeing stronger rates of growth, and acceleration are the large metropolitan areas, see here for more details. […]
By: U.S. Growth, Update on the States | Oregon Office of Economic Analysis on July 28, 2014
at 9:44 AM
[…] Josh Lehner writes that the largest metros (the 51 largest have a population of 1 million or more) have seen the strongest gains in recovery. The second set of metros have seen some acceleration and the nonmetro (rural) counties have seen deceleration over the past year. It is also interesting to note that only the largest cities have seen growth rates return to pre-recession levels, while the others lag. This is at least partly due to the nature of the Great Recession in which housing and government have been large weights on the recovery. These jobs also play a disproportionately large role in many medium, smaller and rural economies than in big cities. […]
By: Blogs Review: The Economics of Big Cities | naked capitalism on August 4, 2014
at 3:49 AM
[…] I’ve previously argued that it’s larger metro areas of greater than a million people that are competitively advantaged in the modern economy. Conveniently, someone from the Oregon Office of Economic Analysis took at look at job growth performance of metro areas by metro area size. […]
By: The Urbanophile » Blog Archive » Metro Size and Job Growth on August 14, 2014
at 7:26 AM
[…] two that have been particularly hard hit since 2007. Additionally, growth across the U.S. has been strongest among the largest metropolitan areas, however as housing and government continue to improve, more areas are participating in the […]
By: County Employment in Oregon, July 2014 | Oregon Office of Economic Analysis on August 19, 2014
at 1:39 PM
[…] denser metros have performed considerably better, according to a recent analysis that charts metro employment growth since the economic […]
By: AMGREF GROUP – Cities Are Clearly The Place To Be After The Great Recession on October 20, 2014
at 6:46 AM
[…] Get the full report […]
By: Large metros have generated the lion's share of employment since the Great Recession | EconomicDevelopment.org on October 22, 2014
at 8:49 AM
[…] and those that have found post-degree jobs often find them in major cities. A study by the Oregon Office of Economic Analysis found that large cities with dense urban centers are seeing the fastest economic recovery since […]
By: UrbanityFair on October 23, 2014
at 9:49 PM
[…] Cortright, who also chairs the Governor’s Council of Economic Adivsors, I have updated our previous work looking at employment growth by metro size across the country. In the big picture, not much has […]
By: Metro Size and Employment, 2015 | Oregon Office of Economic Analysis on September 25, 2015
at 8:10 AM