Our office routinely makes mention of the slower economic and revenue growth in the coming decade as the Baby Boomers age into their retirement years. I just wanted to share a couple graphs on the matter, taken from some work our office did for the CFO and budget folks across state agencies. Using the consumer expenditure survey (CEX) data by age from BLS, the following shows a rough approximation of how income and spending change as people age. More importantly for our office’s work, and our counterparts in other states as well, how taxable income and spending patterns change with age. This income-sales tax comparison post from a year ago, goes into much more depth on these changes and also revenue growth and performance, for those interested in more.

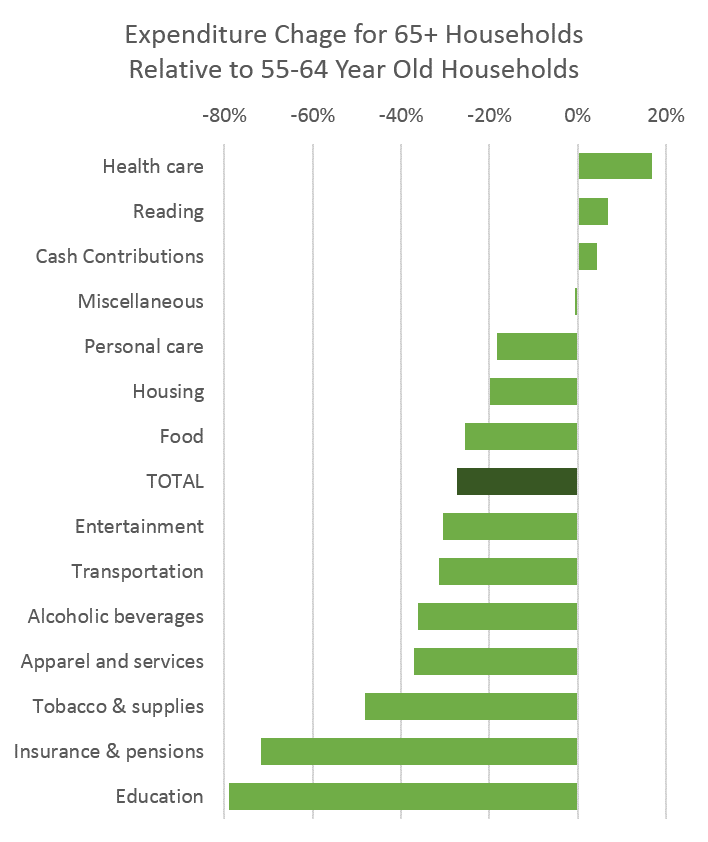
In terms of what older households (technically consumer units in the CEX parlance) do and do not spend money on, the following shows the change in spending across major categories for retirement age folks compared with those in their late 50s and early 60s (where about half of the Boomers are today). Overall, spending falls. A lot. In come categories, shockingly so. 27 percent decline across all categories, and 20-40 percent for most categories. The only categories to see an increase are health care, reading and cash contributions (gifts, donations, etc).
Generally, one tends to think of these spending declines as a sales tax state problem. Sure the income declines will affect Oregon, but these various spending declines are not discussed as much given we do not have a sales tax. However, they will certainly impact a lot of the state’s various revenue streams, what are largely called, Other Funds. These are not General Fund revenues (mostly personal income and corporate excise taxes) or Federal Funds (grants, etc). These include licenses and fees (DMV, fishing, hunting, etc), gas taxes, tuition (not many continuing education courses or college age children), alcohol and tobacco sales and the like. Our office has the general fund revenue outlook pegged around 10 percent per biennium over the extended horizon, compared with previous expansions at more like 16 percent, but the other revenue streams for the state will face downward pressure as well as the Baby Boomers continue to age into retirement and their spending patterns shift. These changes will not occur overnight, but over the next 5-10 years, this is certainly the expectation moving forward.

You wrote: “compared with those in their late 50s and early 60s (where most Boomers are today).”
We want to be careful about characterizing the numbers of individuals by age category. Currently, many of the Boomers are in their early 50s.
The Baby Boomers were born in 1946 through 1964 (inclusive). So, these people now range in age from 49 to 68.
The PSU population estimates for Oregon that were published in April 2013 are for the date of July 1, 2012, which is almost two years behind us now. These numbers show that the Oregon population for the five-year age cohort for those 50-54 was about 270,000. For those aged 55-59 it was also about 270,000.
However, for those aged 60-64 it drops down to about 244,000. For those 65-69 it drops down to about 186,000.
So, pulling things forward two years, we see that currently the majority of Oregon Baby Boomers are in their early-to-late 50s. There are substantially fewer who are currently in their 60s.
Overall, the Boomer phenomenon and its effects bear watching and I don’t mean to meaningfully detract from your analysis. But, due to mortality, the younger Boomers now outnumber the older Boomers.
By: David Cooke on March 19, 2014
at 2:10 PM
Thanks David. You’re right that the younger Boomers outnumber the older ones. However the age group I was specifically focused on, as shown in the second graph, was 55-64 year olds. Obviously, this includes Boomers in both their late 50s and early 60s, and once you combine those together, you get 53 or 54 percent of the Boomers in that cohort. It’s not much of a majority and I have loosened the language in the post. Thanks again.
By: Josh Lehner on March 19, 2014
at 2:29 PM
[…] given the relatively small changes plus the differential with Washington remains large. However, as discussed previously when looking at spending patterns by age, retirement age households spend 48 percent less on […]
By: Tobacco and Taxes | Oregon Office of Economic Analysis on March 20, 2014
at 10:06 AM
[…] city size and the like, based on the consumer expenditure survey data our office has been diving into a lot recently. The purpose being to examine how each of these various aspects of the economy […]
By: Oregon, Alcohol and Demand | Oregon Office of Economic Analysis on March 21, 2014
at 11:18 AM
[…] times of economic expansion, state revenue usually grows 16 percent during each two-year budget cycle, said Josh Lehner, a senior economist with the Oregon Office of […]
By: Oregon’s aging population will lead to slower economic, revenue growth, state economists say | Business News on March 25, 2014
at 12:02 PM
[…] A blog post by Josh Lehner, a state economist, also shows how different sectors of the economy will be affected as the population ages. Spending plummets at age 65 in just about every category but health-care and reading materials. People also donate more in cash and gifts between age 65 and 74 than when they are younger. […]
By: The importance of growth as workforce ages: Editorial | Oregon News on March 29, 2014
at 8:01 PM
The governor and legislature have already begun the process of getting more tax money out of Oregon’s seniors – greatly reducing and/or eliminating the state’s medical expense income tax deduction and cutting back on PERS benefits including for those with the very lowest monthly pension amounts. . Whether the measures taken and more to come will increase or lower Boomer discretionary spending is moot: the battle lines have been drawn – kids and schools against seniors – and that is how the issue will be seen for years to come. The state’s Office of Economic Analysis is providing the statistical and “scientific” justification
By: Holly T. on May 16, 2014
at 11:45 AM
[…] Below are my slides on state tax systems. More information on the border tax effect can be found in my academic paper, coauthored with Rossitza Wooster, Professor at Portland State University (gated, ungated). Additional materials can be found here: border tax effect, tobacco taxes, sales and income tax comparison, and aging revenues. […]
By: PNREC 2014 | Oregon Office of Economic Analysis on May 2, 2014
at 11:06 AM
[…] there is the broader issue of an eroding tax base, something our office previously discussed as well. With an aging demography and with a larger share of purchases shifting from goods to […]
By: Tax Structure and Volatility | Oregon Office of Economic Analysis on February 27, 2015
at 9:21 AM
[…] about longer-term growth rates due to these demographic trends. From our perspective it has big implications for tax revenues and public services. Grandma not only has lower income than during her working years, she spends less and what she does […]
By: Economic Drags and the Outlook | Oregon Office of Economic Analysis on April 13, 2015
at 10:01 AM
[…] I will demur for the time being. See here for previous thoughts on sales vs income taxes and the impact of aging on revenues. Full slides at the […]
By: U.S. Regional Job Growth Update, July 2016 | Oregon Office of Economic Analysis on July 28, 2016
at 9:43 AM