This week I will have a three part series on housing which touches on a few different aspects of the industry and its impact on the economy. What follows is Part 1 which takes a look at the underlying housing demand fundamental and demographics. In Part 2 I will cover recent changes in housing affordability and in Part 3 I will introduce a newer and improved version of the housing and related industries for employment.
At the Southern Oregon Economic Summit there was one housing graph in particular that stood out to me from the National Association of Home Builders’ Chief Economist David Crowe. I intentionally left it off the Summit summary post a few weeks back because I wanted to focus more on it. It is both elegant and simple, the best kind of graph and it tells quite the story for the underlying fundamentals for both the housing industry and the economy more broadly.

You can clearly see the Baby Boomer cohort in the graph which was then followed by the children of the Silent Generation which was a smaller age cohort. Following that you see the echo Boomers moving into their 20s (and some into their 30s). While we know this demographic pattern in general what are the economic consequences of this? We have (or are about to) a generation of young adults transitioning into adulthood and if the economy is strong enough into jobs, higher incomes, purchasing cars and moving out of their parents’ homes into apartments or buying homes themselves. The factoid highlighted in yellow means that over this transition period from college age to mid-30s the headship rate (household formation, effectively) triples from 16% to 48%. Generally we also tend to think of this in terms of marrying and starting a family during these years. Along with it are increases in homeownership, also via NAHB’s Crowe.
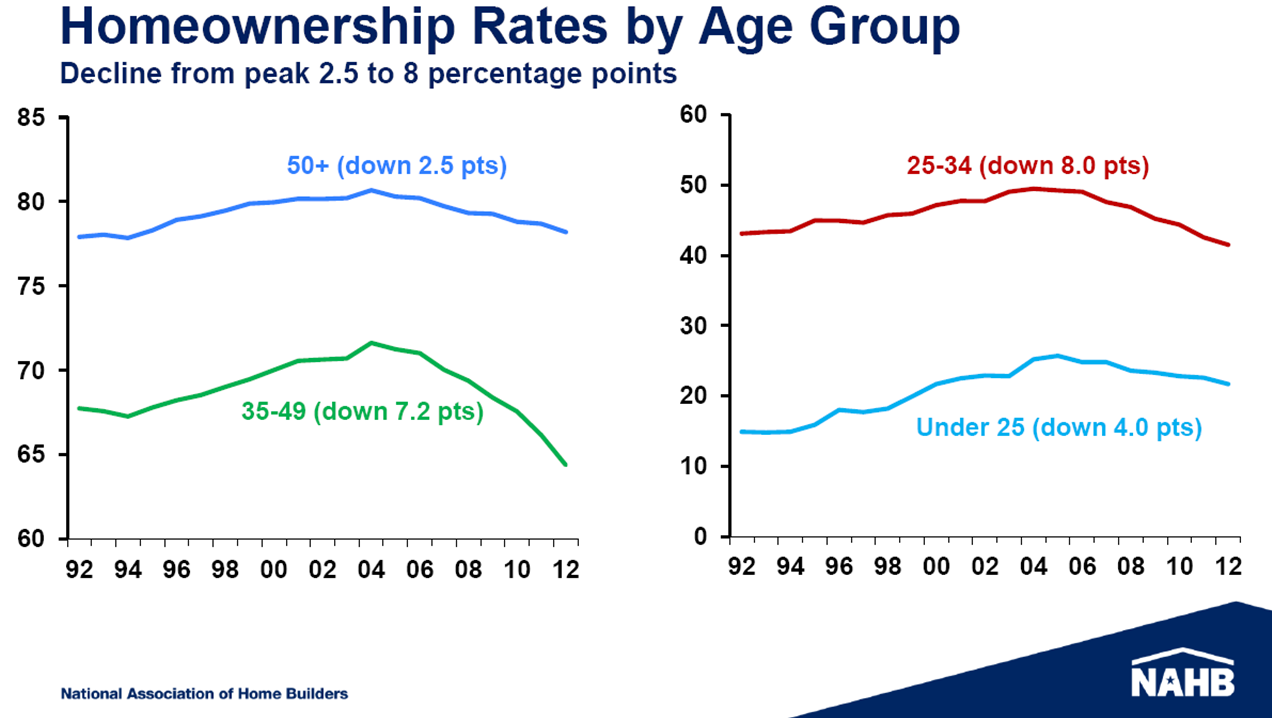
Certainly ownership rates have fallen (some considerably) since the bursting of the bubble, however as you move from your 20s into your 30s into your 40s and 50s, ownership rates jump dramatically. There has been some research indicating that today’s youth are less likely to take on debt related to automobile purchases or homeownership. Some of it may be a cultural shift, and we know that today’s youth are saddled with higher student loan debt which does impact their ability to take on additional, more traditional, debt like car and home loans. However, as seen in the first graph there is a very large cohort of young adults transitioning in the coming decade and they will have an impact on the economy. As Baby Boomers continue to retire en masse, the children they left behind (plus the migration that has occurred over these years as well) will replace them in the economy and in demand for housing. The stronger the economy and the better job opportunities out there, the stronger this impact will be.
In terms of Oregon, our age structure largely looks similar to the nation however we do have one important difference.

While the echo Boomers (plus migrants) are, roughly, of the same size as the retiring Baby Boomers, notice how in the yellow highlighted portion, which is the same as the national version above, Oregon does not have declines. This is likely due to our strong in-migration from elsewhere helping to fill in our demographic gaps. Mark is in the process of writing a more detailed analysis of our migration trends and their impact on the economy so I will leave to the side this part of the discussion for now. However I will add that while the state appears to have a more balanced overall age structure than the U.S. it is not uniform across the state. The gap seen in the 25-35 age cohort at the national level is filled in for the Portland MSA while not for the rest of the state. Furthermore, if you go county by county even in Portland it is not uniform either. That bump in 25-29 year olds is all about Multnomah County and a little about Washington County while the other counties in the MSA see structures similar to the nation.

In terms of homeownerhips rates and household formation, Oregon is very similar to the U.S. overall. Going from college age to mid-30s homeownership rates increase by a factor of 5 and the share of the population that is part of a household more than doubles. With such a large age cohort entering into this transition period, which may take a bit longer this time due to the lackluster economic recovery to date, it does bode well for future economic activity over the coming decade or so.

Finally, in terms of homeownership rates by household structure, the highest ownership rates are for married families, while all other household types have significantly lower ownership rates.

Check back in the coming days for Part 2 on housing affordability and Part 3 on housing and related industries employment.

[…] Monday in Part 1 of this three part housing series, I discussed the housing demand fundamentals from a demographic […]
By: Housing Affordability | Oregon Office of Economic Analysis on July 16, 2013
at 9:20 AM
[…] case you missed it, Part 1 of this series looked at housing demand fundamentals and demographics and Part 2 examined housing […]
By: Housing and Related Industries | Oregon Office of Economic Analysis on July 17, 2013
at 9:16 AM
Those who subscribe to that theory say easy credit encouraged speculators to buy property, which artificially inflated home prices. Now that the Fed has restored interest rates closer to their traditional levels to keep inflation in check, credit is tighter and housing prices must fall in response — or so the theory goes.
By: Ebony G. Kane on July 18, 2013
at 4:08 PM
Given both Chairman Bernanke’s and other Fed official’s speeches in recent weeks, the evidence is that the Fed did not intend to raise rates via expectations, particularly as there are no signs of inflation. If anything, inflation is too low with the latest PCE indicating the lowest year-over-year gain in recorded history. However, I agree, with rising prices and rates, either the price increase must moderate or the housing recovery can be short circuited. Our baseline outlook is for modest price gains in the coming two years, following the price surge in the past year or so.
By: Josh Lehner on July 19, 2013
at 11:02 AM
Perfectly written topic material , thanks for selective data .
By: machine shop dallas tx on July 22, 2013
at 12:47 PM
There is no doubt that statewide demographics are one important component of housing demand. Of course one must also consider other factors in assessing the likely trajectory of housing demand. During this housing boom and bust cycle, other factors have trumped demographics in affecting the swings in housing demand.
Bill McBride does a nice job with his charts of U.S. new home sales, going back to 1963, for example:
http://www.calculatedriskblog.com/2013/07/new-home-sales-at-497000-annual-rate-in.html
In 2004, 2005 and 2006 there were more than 1,200,000 new homes sold per year. This plunged to below 400,000 per year for each year during 2009 thru 2012. The magnitude of this swing was unprecedented in post-WWII U.S. history. This recent period that lasted for more than 10 years, and is still ongoing, was indeed a phenominal boom and bust cycle in new home construction and sales. Since new home sales are such a key determinant of national GDP growth, it seems to me that the importance and magnitude of this home sales cycle is often underestimated by most economic observers.
Where do we go from here? It looks like the uptrend in new home sales, from about 300,000 (SAAR) in early 2011 to the current pace of nearly 500,000 will continue. If this figure rises quickly to 600,000 then 700,000, it will prove to be a substantial boost to U.S. GDP growth.
My guess is that most of this recent upturn in new home demand is not being caused by gradual trends in demographics, but rather by the unwinding of the housing bust. Factors at play include extremely loose U.S. monetary policy, continuing healing in terms of foreclosures and personal balance sheets, gradual economic recovery, and a return to more normal levels of new home demand.
By: David Cooke on July 26, 2013
at 9:11 AM
[…] with more jobs and more income, the demand for housing will as well. Don’t forget that the demographics are in our favor as well with the millenials and children of the Baby Boomers entering into their root setting years […]
By: Quick Housing Update | Oregon Office of Economic Analysis on October 17, 2013
at 1:23 PM
[…] of the housing recovery these past few months — at least temporarily — however the fundamentals do remain strong. The strong price gains are mostly driven by lack of supply and increasing demand, however new […]
By: Update on Housing and Affordability | Oregon Office of Economic Analysis on November 14, 2013
at 12:41 PM
[…] the national average was 37.3 years. You can see that in the pyramid graph below. It also shows the larger share of Oregonians in their “root setting” years as discussed previously when examining the housing […]
By: Oregon’s Population | Oregon Office of Economic Analysis on January 14, 2014
at 1:02 PM
[…] but single family (and ownership) will make a strong return in the next couple of years. Remember: demographics are actually in housing’s favor in the near term which also bodes well for overall economic […]
By: Renting vs Owning | Oregon Office of Economic Analysis on February 21, 2014
at 8:47 AM
[…] Thankfully, in the big picture this slowdown is likely to prove temporary. The market should settle as buyers become accustomed to higher interest rates — which should also slow price gains, holding affordability somewhat steady — and increased demand resumes from both a stronger economy (more jobs and income) and a pickup in household formation as demographics are in our favor. […]
By: The Housing Stall | Oregon Office of Economic Analysis on February 27, 2014
at 10:00 AM
[…] I have been examining employment trends in 25-44 year old Oregonians (those in the so-called “root setting” years) as these ages are when many individuals get married, have kids, buy a home, enter the […]
By: Jobs, Labor Force and Population | Oregon Office of Economic Analysis on July 18, 2014
at 8:32 AM
[…] cohort, relative to the rest of Oregon and the nation. Ages 25-34 are very important in terms of setting down roots as this range is when most individuals, get married, buy a house, start a family, begin their […]
By: Portland Housing Pt 2: Construction and Demographics | Oregon Office of Economic Analysis on October 30, 2014
at 10:55 AM
[…] and retiring population is the issue, then young, working age households are the cure. We have highlighted previously the impact of individuals in their root setting years, generally 25-34 years old. During […]
By: Population, Demographics and Generations | Oregon Office of Economic Analysis on February 5, 2015
at 10:40 AM
[…] and elsewhere, is a positive development. It brings both skilled, young households who will set down roots (no, they are not all degree holding baristas) and a strong influx of retirees with a lifetime of […]
By: Migration (In Defense of Californians) | Oregon Office of Economic Analysis on September 8, 2015
at 10:05 AM
[…] and retiring population is the issue, then young, working age households are the cure. We have highlighted previously the impact of individuals in their root setting years, generally 25-34 years old. During […]
By: Oregon population statistics | Oregon Tax News on September 21, 2015
at 7:15 AM
[…] influenced our office over the years, particularly when it comes to demographics and housing (see here from a couple years ago, more recently our peak renter work flows from that earlier analysis). He did touch on stronger […]
By: Housing Forecast Takeaways | Oregon Office of Economic Analysis on November 17, 2015
at 1:43 PM
[…] a net influx of residents across all age groups. However, a disproportionate number are in their root-setting years; that important decade from mid-20s to mid-30s when most people settle down, begin their careers in […]
By: Who Moves to Oregon? (Graph of the Week) | Oregon Office of Economic Analysis on January 11, 2016
at 9:42 AM