In recent quarters, Andre Harboe has been doing good work in our office on creating and using some unique, or offbeat, economic indicators, or at least in terms of regional or state economies. For the March forecast, Andre worked on turning the Employment Department’s Around the State news publications into a good news – bad news ratio that does, in fact, lead the business cycle or at least employment in Oregon. This quarter, Andre disaggregated and reworked ODOT’s vehicle miles traveled (VMT) data into passenger vehicles compared with trucks and buses, and their longer-term trends and business cycle patterns. At the national level Calculated Risk tracks both the diesel fuel index and ATA trucking index. The purpose being that these are measures of business activity, and therefore economic activity. State level measures like this are not readily available that we could find, so Andre analyzed and reworked some of the Oregon data to produce the following. Furthermore, comparisons in overall VMT trends among western states is discussed. This is excerpted from the May forecast document, specifically the western section.
Vehicle miles traveled is an important measure to examine on a number of fronts as it is simultaneously a measure of economic activity (the movement of goods) and personal travel patterns. Given the data available, distinguishing between these two components of VMT is technically complicated, however important from an economic analysis point of view. In consultation with both the U.S. and Oregon Departments of Transportation, the following breaks down the available data for Oregon and then compares VMT trends across western states.
Divergence in Vehicle Miles Traveled
The [graph below] shows the growth in VMT in Oregon and nationwide. Historically, recessions would slow the growth in VMT or cause it to dip slightly, but it would subsequently resume its growth as economic activity rebounded and consumers drove more. This did not happen in the last recession. Even though Real GDP has rebounded from 2007 highs, VMT has not.
There are many theories for this lack of growth: high gas prices, a lackluster economic expansion, aging population, telecommuting, availability of mass transit, changing driving culture, particularly among today’s youth, etc. What is interesting is that Oregon began this trend well before the previous recession and diverged from the national trend in 2000.
From 1979 till 2000, Oregon’s VMT growth mirrored that of the nation. The divergence began in the 2001 recession and the trend lines have not met since. VMT at the economic peak in 2006 was essentially the same as that in 1999.

Breaking Oregon’s VMT numbers down by rural and urban roads reveal divergent patterns. Urban VMT is 15 percent above their 1999 base (which translates into an increase of about 2.4 billion miles) but has remained essentially flat since 2008. While growth in Oregon’s urban VMT was fairly slow overall, the lack of increased VMT following the recession mirrors the national trends. Rural VMT has lost about 20 percent since 1999 (this translates into a loss of 3.7 billion actual VMT) and has also remained fairly flat since 2008.

Deciphering economic activity from personal driving within the VMT data is difficult. However, a meaningful proxy is to separate passenger vehicles from larger trucks. Some passenger vehicles are used for business purposes and represent underlying economic activity, however the converse is not true to the same degree. Not many VMT by large trucks can reasonably considered personal travel. Overall in Oregon, VMT traveled by trucks and buses since 1999 has grown by 24 percent. A large increase in 2006 was mainly due to growth in combination trucks being driven on rural roads, i.e. logging trucks.
The Great Recession had a large negative impact on truck miles traveled as the movement of goods stopped as businesses sold fewer products and therefore did not need to replenish inventories as quickly. This large loss happened over a year before the recession began and the recovery commenced in the middle of the recession. This also occurred in the 2001 recession where truck and bus miles fell more than a year before the recession and was well into recovery during the recession. Since its low point in 2007, there has been a swift recovery in truck miles and in 2011 this category of VMT was 21 percent higher. Light trucks (under 10,000 lbs), passenger cars and motorcycles on the other hand are 3 percent lower than in 2008 and 7 percent lower than in 1999.

As with all data, there are some caveats. VMT is an estimate created by the Oregon Department of Transportation. Some 5,000 miles of rural roads have been removed from VMT calculations. In addition, 2,000 miles of rural roads were redefined as urban due to the 2000 Census, artificially lowering rural VMT miles.
Western States
Comparing Oregon to other western states in terms of growth in vehicle miles traveled illustrates the dichotomy between states. Each state has experienced its own path in terms of driver behavior, economic activity, population growth and the like. Oregon posted the lowest overall growth in VMT compared with regional neighbors. Oregon was also the only state to have growth below the national average since 1980. VMT growth in Oregon over this period was 75 percent – that is, VMT in Oregon today is 75 larger than in 1980 – while the nation as a whole experienced a 98 percent increase. Nevada had the highest growth among all western states at nearly 300 percent. Arizona was not far behind at well over 200 percent growth.
The above mentioned numbers do not adjust for population growth within the states, which is a large determinant of total VMT. When one looks at annual vehicle miles traveled per capita and chart out its growth, Nevada goes from having the highest growth to one of the lowest. The state underwent very strong population growth during this time period and even as VMT per capita remains relatively low, the fact that the population of the state increased approximately 330 percent led to the gains in VMT. On the other hand, Arizona experienced large population gains but an even larger increase in VMT. This results in Arizona being the only western state that is at or above the national average in terms of per capita VMT. At this point in time it is unclear, entirely, what constitutes the large gains seen in Arizona in the mid-1980s. A large amount of work on Interstate 10 in and around Phoenix occurred during this time, ultimately being completed through downtown Phoenix in 1990. These changes likely resulted in some of these gains.
Oregon Peaked in 1999 with an average of 10,218 vehicle miles traveled per capita. It has since fallen by 15 percent to 8,651 in 2011. Since the Great Recession, the average VMT miles traveled per capita fell by 7.3 percent since 2007.
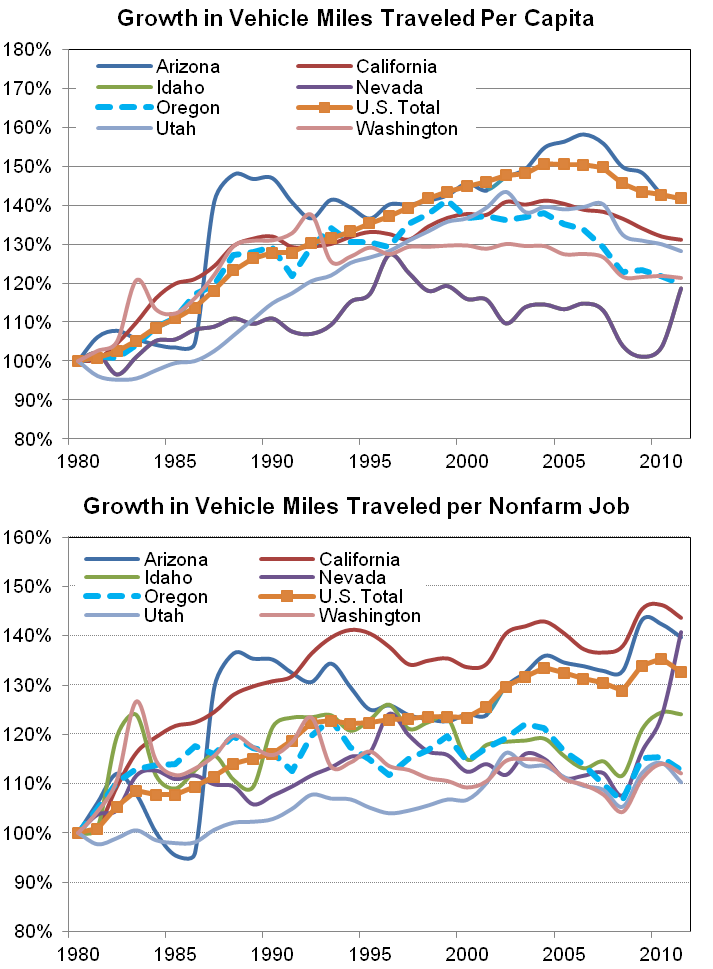
Looking at VMT per nonfarm job, however, shows an opposite effect. As the Great Recession began, VMT per nonfarm job was an average of 20,600 for the western states. It grew to 22,500 in 2011. This makes sense as the number of jobs fell, vehicle miles traveled did not drop as fast as employment, increasing its ratio.

[…] issue of vehicle miles traveled. Nationally VMT is effectively flat, while VMT per capita is down. In Oregon we’ve seen similar, yet more pronounced, trends. One contributor to this decline is the fact that younger individuals […]
By: Vehicle Miles Traveled, Age Edition | Oregon Office of Economic Analysis on December 8, 2014
at 10:11 AM
[…] populated counties declined in population in the same span of time. In a 2013 blog post, the state Office of Economic Analysis confirmed that a drop in rural driving was the main cause of the state’s overall VMT […]
By: Fossil Fuel Debate: Why Are Oregonians Driving Less? - noticiasonoticiaso on June 18, 2015
at 12:24 PM
[…] One aspect of traffic that has really changed over the past 15 years or so is driving behavior. Even as the state’s population continues to increase, for much of that time period total traffic volumes were flat. On an individual basis we were and are driving considerably less than we were historically. Based on the data, it’s clear that prices matter. As gas prices increased during the mid-2000s, driving behavior shifted down and remained low throughout the Great Recession and its aftermath. However now that prices are low again — and they’re up y/y today but still low relative to the past 10 years — driving has made a rebound. That said, VMT per adult remains considerably lower today than last decade even with the rebound in recent years. For more on VMT trends, see our office’s previous work. […]
By: Oregon Traffic, A VMT Update | Oregon Office of Economic Analysis on March 15, 2017
at 10:31 AM
[…] Northwest’s cheap hydropower driving lower energy spending. As discussed previously, total vehicles miles traveled in Oregon first peaked in 1999, nearly a decade before the US overall. Now, VMT has picked up in recent years and recently set a […]
By: Oregon’s Energy Intensity and Household Spending | Oregon Office of Economic Analysis on November 8, 2018
at 9:32 AM